RESEARCH
Financial Benchmarks
for Direct-Market
Vegetable Farms
2021 Report
Franklin Egan, Sarah Bay Nawa

Study Contributors
Thank you to the 39 farmers who contributed
their time, insights, and data to this study.
John Hendrickson, Brad Barham, and Matthew Klein
(University of Wisconsin) helped design our survey
instrument and analyze data.
This study was initially made possible with generous
investments from Lady Moon Farms, the Jerry Brunetti
family, the Shon Seeley family, and more than 120
private donors.
Additional support was provided by a Pennsylvania
Department of Agriculture Specialty Crop Block
Grant and a Pennsylvania Department of Agriculture
Research Grant.
Report Contributors
Authors: Franklin Egan, Sarah Bay Nawa
Reviewers: John Hendrickson (University of Wisconsin);
William Kitsch (Ephrata National Bank); Elaine Lemmon
(Kitchen Table Consultants); Hannah Smith-Brubaker
(Pasa Sustainable Agriculture)
Editor: Melissa Cipollone
Proofreader: Marie Hathaway
Layout: Matt Todd
© Pasa Sustainable Agriculture. All rights reserved.
This report is available on Pasa’s website at
pasafarming.org/nancial-benchmarks-2021.
For more information about this report, contact
research@pasafarming.org.
Pasa Sustainable Agriculture cultivates environmentally
sound, economically viable, community-focused farms
and food systems.

Executive summary 4
Introduction 6
Participating farms 7
Methods 9
Benchmarks 10
Vegetable enterprise benchmarks 10
Farm business benchmarks 15
Insights 18
Trends: 2017–19 23
Three pathways to higher incomes 25
Public support for fair farm incomes 27
Conclusion 28
References 30
Contents

4 | FINANCIAL BENCHMARKS FOR DIRECT-MARKET VEGETABLE FARMS
Executive summary
Direct-market vegetable farming—where farmers sell their produce through
farmers markets, community supported agriculture (CSA) programs, on-farm
stores, and direct wholesale—is a growing sector of the agricultural economy
in the Mid-Atlantic region and nationally. Yet despite its popularity among both
farmers and eaters, there is little information available to help farmers start
and grow successful direct-market businesses.
In2017welaunchedanongoingstudytohelpllthiscriticalgapin
information and provide insights that could help vegetable farmers start and
growsuccessfulbusinesses.Wecompiledcustomnancialbenchmarkreports
for each farm participating in the study, and we hosted meetings where
participantscouldshareanddiscusstheirbusinessnancesopenly.
Thisreportsharesdetailednancialbenchmarksandinsightsfromthe39
vegetable farms that participated in our study. These farms were all located
in four Mid-Atlantic states (Pennsylvania, Maryland, Virgina, West Virginia) and
sold some or all of their produce through direct-market channels during tax
years 2017 through 2019. We also share trends over time for a subset of 19
farms that participated in our study all three years. Lastly, we explore strategies
farmers can use to improve their direct-market income, and consider how
publicpolicycansupportthelong-termnancialviabilityoftheseessential
businesses.
To our knowledge, this report is the most comprehensive review of direct-
marketvegetablefarmbusinessmodelsproducedtodate.Ourndings
include:
• Most direct-market vegetable farmers are not earning a middle-
class income. A quarter of farms in our study earned more than the
Pennsylvania median household income. Most, though, had a median net
farm income that was less than half the Pennsylvania median for all farms.
• No single direct-market channel outperformed all others. We found
that all of the major direct-market channels used by farms in our study—
farmers markets, CSAs, direct wholesale—had a mix of higher and lower
income cases.
• Larger production scales bring higher incomes. Farms in our study with
more acres in vegetable production generally realized higher net incomes
than farms with less acres in vegetable production.

PASA SUSTAINABLE AGRICULTURE | 5
• Farms that focus on vegetables make more money on vegetables—
but may miss out on higher net incomes from other enterprises.
We found that farms in our study operating enterprises beyond solely
marketing vegetables grown on their farms had higher net farm incomes.
This was especially true for farms that resold products from other farms.
• Farms steadily increased incomes and equity over time. Farms in our
studygenerallybecomemoreprotablethelongertheywereinbusiness.
Most farms exceeded the Pennsylvania median household income
within12yearsofbusiness,whileaccumulatingsignicantwealthinland,
buildings, and equipment assets.
• There are three major pathways to make more money growing
vegetables. Our data point to expanding production scale, increasing
revenueperacre,orimprovingcostandlaborefciencyasthetopthree
strategies for increasing direct-market vegetable income.
• The nancial benchmarks presented in this report are consistent with
persistent structural challenges in the agricultural industry. Creating
and expanding public programs is necessary to help direct-market
vegetable farmers continue their essential work providing fresh, nutritious
food for their communities.
• Farmers value sharing and discussing nancial data. Most farmers
participating in our study found the insights they received and the
opportunitiestodiscusstheirbusinessnanceswithotherfarmers
in a safe environment highly valuable.
Our Direct Market Benchmark Study is an ongoing project. Since compiling the
ndingsdetailedinthisreport,we’vepartneredwithpeerorganizationsinNew
England (Community Involved in Sustainable Agriculture) and the Carolinas
(Carolina Farm Stewardship Association) to expand the scope of our study to
include data from vegetable farms located outside of the Mid-Atlantic region.
We will also be analyzing the impact the COVID-19 pandemic has had on
participating farms in a future report.
GET INVOLVED: If you own or manage a vegetable farm that sells some or
all of your products through direct market channels, we welcome you to join
our ongoing study. Learn more at pasafarming.org/research or contact us
at research@pasafarming.org to get involved.

6 | FINANCIAL BENCHMARKS FOR DIRECT-MARKET VEGETABLE FARMS
Introduction
Farmers markets, community supported agriculture (CSA) programs, farm
stands, and direct wholesales to grocery stores, restaurants, and institutions
are sales channels that have long been cornerstones of the sustainable
agriculture movement in Pennsylvania and across the U.S. By building in-person
relationships with customers and garnering price premiums for fresher, higher
quality, and more sustainably grown produce, direct-market vegetable farms
have carved out an important niche in the modern agricultural industry. The
National Agricultural Statistics Service (2016) estimates that direct-market
farms generate $439 million in sales per year in Pennsylvania, with much of this
business coming from vegetables.
1
Direct-market farming has provided an on-ramp into farming careers for
many beginning farmers and supplied communities with better access to fresh,
nutritious food. Direct-market farms have also pioneered sustainable growing
techniques that rely on biodiversity to build soils and control pests. Yet, despite
the big-picture success of direct-market business models, there is surprisingly
little information available to help current or aspiring farmers answer a very
basic question: Can farmers make a middle-class income selling vegetables
through direct-market outlets?
Thisreportcontributestoaverysmallsetofresourcesexploringnances
for direct-market vegetable farms. Existing resources on this topic include
data compiled by Practical Farmers of Iowa and the Center for Integrated
Agricultural Systems.
2,3
Our data set also expands on existing resources by
including a range of variables describing each participating farm’s market
channels, production scale, level of diversity and specialization, and years of
farming experience. This allows us to provide a uniquely detailed look at some
ofthekeyfactorsshapingnancialoutcomesfordirect-marketfarms.
Despite the big-picture success of direct-market business
models, there is surprisingly little information available
to help current or aspiring farmers answer a very basic
question: Can farmers make a middle-class income selling
vegetables through direct-market outlets?
“

PASA SUSTAINABLE AGRICULTURE | 7
Participating farms
Since the fall of 2017, we have recruited 39 farms in Pennsylvania, Maryland,
Virginia, and West Virginia to participate in our Direct Market Financial
Benchmarks Study (Table 1). All eligible farms needed to be for-prot
commercial operations and generate a signicant portion of their revenue
through direct-market sales of produce grown on the farm.
TABLE 1. PARTICIPATING FARMS BY YEAR
Year Number of farms
2017 36
2018 32
2019 23
Total 39
Of the farms that participated in our study in 2017, 81% returned for 2018,
with several additional farms joining the project that year. Participation declined
in2019,asmanyfarmsfounditdifculttosubmittheirdatainthespringof
2020 when the COVID-19 pandemic erupted.
We sought out candidate farms through our email newsletter; exhibiting and
presenting at farm conferences and events; and by advertising in various trade
publications.
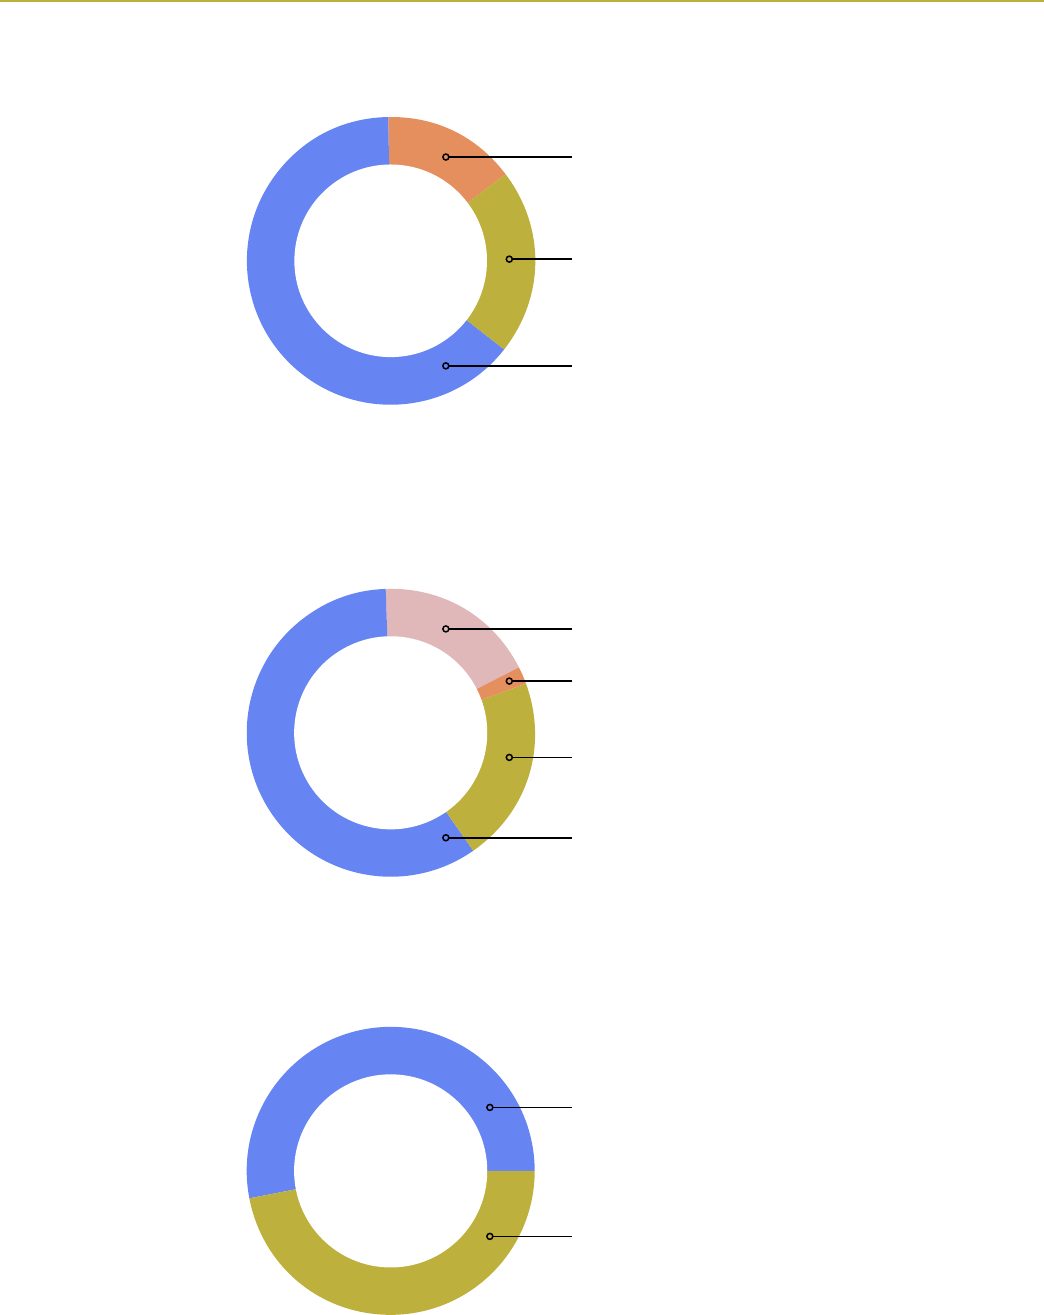
Participating farms typically managed a range of enterprises, including
growing vegetables, reselling products grown or raised on other farms, and
hosting on-farm events and agritourism. Farms were located in peri-urban and
rural areas, and spanned a range of production scales from less than an acre
in vegetable production to more than 90 acres (Figure 1). Participating farmers
also had an assortment of experience levels, ranging from new start-ups to
decades in business (Figure 2). Just under half of participating farms primarily
leased or rented their farmland. Land ownership was more common among
larger farms, with all farms that had more than 12 acres in vegetable production
primarily owning their farmland (Figure 3).
8 | FINANCIAL BENCHMARKS FOR DIRECT-MARKET VEGETABLE FARMS
FIGURE 1. ACRES IN VEGETABLE PRODUCTION
>12 acres (15%)
3–12 acres (64%)
<3 acres (21%)
FIGURE 3. LAND TENURE
Owned land (53%)
Leased or rented land (47%)
FIGURE 2. YEARS OF FARMING EXPERIENCE
Includes experience as farm managers and farm workers
>25 years (18%)
10–25 years (59%)
5–10 years (21%)
<5 years (2%)

PASA SUSTAINABLE AGRICULTURE | 9
Methods
Over the winter months of 2018, 2019, and 2020 we coordinated a series
of in-person and virtual work sessions to help farmers complete a detailed
surveyregardingtheirfarmnancesforthe2017,2018,and2019taxyears.
We developed our survey with support from educators at the University of
Wisconsin, building on a survey they had shared with similar farms in Wisconsin.
Farmers were offered a $100 stipend for completing a survey for each tax year.
Our survey required farmers to draw information from their crop plans,
annualprot-and-lossstatements,ScheduleFtaxformorsimilartax
documents, and business balance sheets. We reviewed each survey carefully,
typically following up with farmers to clarify any ambiguities or inconsistencies
in their responses. As a result, we have a “carrots-to-carrots” dataset for which
we normalized different approaches to bookkeeping among different farm
business models.
Many of the farmers contributing to this project manage multiple
enterprises, including vegetables, livestock, fruit, and resale of products from
other farms. In order to make balanced comparisons, this report presents
benchmarks for each farm’s vegetable enterprise as well as their farm
business as a whole.
Our vegetable enterprise benchmarks refer to the production and
marketing of vegetables grown on each farm (this does not include any
resaleproducts).Ourdenitionofvegetablesforthepurposeofthisstudy
includes melons, herbs, strawberries, and other specialty crops often grown
ondiversiedvegetablefarms.Ourdenitiondoesnotincludeperennialfruit
trees,perennialberries,cutowers,ornurseryorbeddingplants.Farmers
reported vegetable sales by distinct market channels, including farmers
markets, CSA programs, and direct wholesale to restaurants, institutions, and
grocery stores. Many direct-market farms also use intermediary wholesale
channels such as produce auctions, food service companies, and marketing
co-ops.
Our farm business benchmarks refer to all of a farm’s agricultural
enterprises—including vegetables, resale products, nursery plants, livestock,
and agritourism or on-farm events—viewed as a combined business.
We used this data to calculate a series of standard business benchmarks for
each farm’s vegetable enterprise and for their farm business as a whole. We
also explored correlations between benchmark indicators and key aspects of
the farm business model and context, including market channels, production
scale, farmer experience, and enterprise diversity.

10 | FINANCIAL BENCHMARKS FOR DIRECT-MARKET VEGETABLE FARMS
Benchmarks
Thissectionreviewsthenancialbenchmarksachieved
by the 39 vegetable farms that participated in our
study between tax years 2017 and 2019. Each table
represents a combined average for these three years.
We segmented each benchmark by farm scale, so
you can see values for farms with less than three acres
in vegetable production (21% of participants), farms
with more than 12 acres in vegetable production (15%
of participants), and those that fall in between (64% of
participants).
VEGETABLE ENTERPRISE BENCHMARKS
The benchmarks in this section apply to vegetables produced on and marketed by a farm.
TABLE 2. GROSS VEGETABLE ENTERPRISE REVENUE
Scale
Percentile
10 25 median 75 90
< 3 acres $17, 264 $41,844 $64,704 $82,260 $114,761
3–12 acres $32,752 $44,543 $92,030 $140,370 $218,435
> 12 acres $ 457,58 4 $464,974 $488,773 $606,969 $750,297
Gross vegetable enterprise revenue measures the total sales revenue of
vegetables grown on a farm through all market channels combined. This may
include farmers markets, CSAs, on-farm stores, direct wholesale to restaurants,
grocery stores, and institutions, and wholesale through intermediaries.
For each benchmark, we show the 10, 25, median
(50), 75, and 90 percentile value. For example, as shown
in Table 2, the 25th percentile value for gross vegetable
enterprise revenue was $41,844 for farms with less than
three acres in vegetable production. That means that
25% of farms of this scale sold on average less than
$41,844 during tax years 2017–19.

PASA SUSTAINABLE AGRICULTURE | 11
TABLE 3. GROSS VEGETABLE ENTERPRISE REVENUE PER ACRE
Scale
Percentile
10 25 median 75 90
< 3 acres $19,882 $27, 032 $46,413 $56,193 $64,820
3–12 acres $8,393 $11,223 $20,655 $29,194 $33,565
> 12 acres $11,600 $20,854 $23,250 $33,834 $35,342
= gross vegetable enterprise revenue / acres in vegetable production
Gross vegetable enterprise revenue per acre measures the intensity of an
operation—in other words, it shows how much revenue a vegetable enterprise
generatesperacre.Highervaluescanreectcombinationsofmoreproductive
soil, better marketing opportunities, or more intensive management systems.
Acres in vegetable production includes only acres that were used for
vegetable production for at least part of the year. It does not include farm lanes
or acres that were in full-season cover crops or short-term fallow.
TABLE 4. VEGETABLE ENTERPRISE NET INCOME
Scale
Percentile
10 25 median 75 90
< 3 acres -$8,764 $77 $1,844 $6,435 $8,684
3–12 acres -$27,064 -$5,216 $12,079 $30,825 $53,096
> 12 acres $54,052 $74,207 $86,964 $116,079 $161,947
= gross vegetable enterprise revenue – vegetable enterprise operating expenses
Vegetable enterprise net income shows the total income generated by a
vegetable enterprise that is available to compensate salaries for farm owners,
or to make capital investments in the operation.
Ourdenitionofoperatingexpensesincludesallproductionandmarketing
costs for vegetables grown on a farm, including paid labor, land rental costs,
andmortgageinterestpayments.Ourdenitionofoperatingcostsdoesnot
include salaries for farm owners or business partners.

12 | FINANCIAL BENCHMARKS FOR DIRECT-MARKET VEGETABLE FARMS
TABLE 5. NET INCOME PER ACRE IN VEGETABLES
Scale
Percentile
10 25 median 75 90
< 3 acres -$4,310 -$101 $2,163 $2,901 $8,180
3–12 acres - $ 7, 337 -$1,166 $2,890 $6,464 $9,094
> 12 acres $1,950 $2,139 $2,968 $3,232 $7, 016
= (gross vegetable enterprise revenue – vegetable enterprise operating expenses) /
acres in vegetable production
Net income per acre in vegetables shows what a farm earns per acre in
vegetable production after subtracting all operating expenses.
TABLE 6. VEGETABLE ENTERPRISE LABOR PAYROLL TO REVENUE RATIO
Scale
Percentile
10 25 median 75 90
< 3 acres 0% 3% 12% 19% 70%
3–12 acres 11% 19% 26% 31% 53%
> 12 acres 32% 32% 33% 33% 35%
= 100% * paid labor for vegetable enterprise / gross vegetable enterprise revenue
Vegetable enterprise labor payroll to revenue ratio shows the cost of
paid labor associated with a vegetable enterprise relative to gross vegetable
enterprise revenue. It does not include wages or salaries paid to farm owners,
family members, or business partners.
On some smaller-scale farms, where the farm owner(s) and their family
account for all labor, this ratio can be zero. On larger farms with many paid
employees,laborcostscanbeasignicantpercentageofrevenue.

PASA SUSTAINABLE AGRICULTURE | 13
TABLE 7. VEGETABLE ENTERPRISE NET INCOME TO REVENUE RATIO
Scale
Percentile
10 25 median 75 90
< 3 acres -12% -4% 3% 12% 15%
3–12 acres -87% -6% 14% 22% 38%
> 12 acres 9% 9% 14% 26% 34%
= 100% * (gross vegetable enterprise revenue – vegetable enterprise operating expenses /
gross vegetable enterprise revenue
Vegetable enterprise net income to revenue ratio shows vegetable enterprise
net income as a percentage of gross vegetable enterprise revenue. This ratio can
provideinsightintotheprotpotentialandviabilityofavegetableenterprise.
Becauseourdenitionofoperatingcostsdoesnotincludecompensationfor
farm owners, other family members, or business partners, a vegetable enterprise
isprobablynotnanciallyviableifthisindicatorisconsistentlylessthanzero,
or only slightly above zero. By contrast, ratios well above 20% are probably
necessary for most farms to be in a position to compensate farm owners.
Before [this study], we had no basis for comparison
to help determine if we were fairly successful relative
to other farms, as well as how much is reasonable
to expect to make from other similarly sized farm
businesses.
—Study participant
“

14 | FINANCIAL BENCHMARKS FOR DIRECT-MARKET VEGETABLE FARMS
TABLE 8. VEGETABLE ENTERPRISE RATE OF RETURN ON FARM OWNER LABOR
Scale
Percentile
10 25 median 75 90
< 3 acres -$45,956 -$278 $1,462 $2,273 $5,135
3–12 acres -$60,109 -$2,101 $9,819 $16,770 $31,882
> 12 acres $19,840 $20,307 $34,319 $49,248 $56,039
= 100% * (gross vegetable enterprise revenue – vegetable enterprise operating expenses) /
FTEs farm owner labor for vegetable enterprise
Vegetable enterprise rate of return on farm owner laborshowsthenancial
returns of the labor a farm owner(s), other family members, and business
partners contributed to a vegetable enterprise. It is the ratio of the net income
from vegetables to the total farm owner labor on the farm, expressed in full
time equivalents (FTEs) of 2,000 hours per year.
Most farmers work much more than 2,000 hours per year (~38.5 per week)—
half of farmers participating in our study worked more than 45 hours per week
on average, and 25% worked more than 55 hours per week on average. We
standardized the farm owner input in terms of a 2,000 hour annual FTE, such
that a farmer who works 55 hours per week on average would be represented
as ~1.4 FTE.
To put this indicator into context, a vegetable enterprise rate of return on
farm owner labor of $20,000 indicates that each farm owner is earning about
$10 per hour while working on the vegetable enterprise.
[This study] prompted us to take a closer look at our
nances, which is never time wasted. And it’s really
helpful to know how we compare to other farms in
terms of expenses and revenue generated per acre.
—Study participant
“

PASA SUSTAINABLE AGRICULTURE | 15
FARM BUSINESS BENCHMARKS
The benchmarks in this section apply to all enterprises on a farm combined.
TABLE 9. GROSS FARM BUSINESS REVENUE
Scale
Percentile
10 25 median 75 90
< 3 acres $17, 587 $72,259 $80,623 $133,046 $193,922
3–12 acres $62,661 $82,964 $111,876 $216,734 $290,681
> 12 acres $508,299 $579,144 $773,046 $1,158,227 $1,366,547
Gross farm business revenue shows the overall economic scale of a farm
business. As mentioned above, this includes a farm’s vegetable enterprise as
well as all other revenue gained from other farm enterprises. This may include
revenue sources such as eggs, dairy products, meat, agritourism, custom
services, or resold products.
TABLE 10. PERCENT FARM BUSINESS REVENUE FROM VEGETABLE ENTERPRISE
Scale
Percentile
10 25 median 75 90
< 3 acres 55% 60% 75% 86% 98%
3–12 acres 34% 56% 80% 98% 100%
> 12 acres 37% 51% 87% 95% 98%
= 100% * gross vegetable enterprise revenue / gross farm business revenue
Percent farm business revenue from vegetable enterprise shows the
degree to which a farm specializes in vegetable production. It shows a farm’s
gross vegetable enterprise revenue (Table 2) as a percentage of the gross farm
business revenue ( Table 9).

16 | FINANCIAL BENCHMARKS FOR DIRECT-MARKET VEGETABLE FARMS
TABLE 11. FARM BUSINESS NET INCOME
Scale
Percentile
10 25 median 75 90
< 3 acres -$9,536 $2,968 $5,791 $13,577 $21,186
3–12 acres -$8,266 $9,915 $29,907 $52,145 $65,048
> 12 acres -$12,134 $48,915 $81,151 $162,695 $228,083
= gross farm business revenue – farm business operating expenses
Farm business net income shows the total income
generated by a farm business that is available to
compensate farm owners or make capital investments
in the operation.
Ourdenitionofoperatingexpensesincludes
all farm production and marketing costs, including
paid labor, land rental costs, and mortgage interest
payments. Farm business operating expenses may also
include the cost of goods sold for resale products.
Ourdenitionofoperatingexpensesdoesnotinclude
salaries for farm owners, other family members,
or business partners.
TABLE 12. FARM BUSINESS NET INCOME TO REVENUE RATIO
Scale
Percentile
10 25 median 75 90
< 3 acres -7% 3% 9% 17% 19%
3–12 acres -16% 11% 18% 35% 45%
> 12 acres 1% 8% 11% 17% 26%
= 100% * (gross farm business revenue – farm business operating expenses) / gross farm business revenue
Farm business net income to revenue ratio shows the
farm business net income (Table 11) as a percentage of
the gross farm business revenue (Table 9). It provides
insightintotheprotpotentialandviabilityofafarm
business.Becauseourdenitionofoperatingcosts
does not include compensation for farm owners, other
family members, or business partners, a farm business
isprobablynotnanciallyviableifthisindicatoris
consistently less than zero, or only slightly above
zero. By contrast, ratios well above 20% are probably
necessary for most farms to be in a position
to compensate farm owners.

PASA SUSTAINABLE AGRICULTURE | 17
TABLE 13. FARM BUSINESS RATE OF RETURN ON FARM OWNER LABOR
Scale
Percentile
10 25 median 75 90
< 3 acres -$9,777 $1,484 $3,826 $6,692 $11,885
3–12 acres -$8,217 $7, 8 0 0 $14,990 $19,130 $39,986
> 12 acres -$31,984 $18,917 $26,937 $54,935 $68,411
= (gross farm business revenue – farm business operating expenses) / FTEs farm business labor
Farm business rate of return on farm owner labor
showsthenancialreturnsofallofthelaborfarm
owners, other family members, and business partners
contributed to the farm business. It is the ratio of
the farm business net income (Table 11) to the total
farm owner labor on the farm, expressed in full-time
equivalents (FTEs) of 2,000 hours per year.
While most farmers work much more than full
time—half of farmers participating in our study worked
more than 45 hours per week on average, and 25%
worked more than 55 hours per week on average—we
standardized farm owner labor in terms of a 2,000 hour
annual FTE (~38.5 hours per week).
To put this indicator into context, a farm business
rate of return on farm owner labor of $20,000
indicates that each farm owner is earning about $10 per
hour while working on the farm business.
TABLE 14. FARM BUSINESS DEBT-TO-ASSET RATIO
Scale
Percentile
10 25 median 75 90
< 3 acres 0% 0% 6% 49% 79%
3–12 acres 0% 1% 18% 46% 67%
> 12 acres 5% 13% 25% 50% 61%
= 100% * farm business debts / farm business assets
Farm business debt-to-asset ratio is a measurement
of a farm’s overall solvency. It shows the proportion of
assetsthatarenancedbyloansversusinvestments
from a farm family and business partners. This indicator
is the ratio of the remaining principal on debts owed by
a farm business (including mortgage debt for farmland,
loans for equipment purchases, and operating loans)
to the estimated market value of the farm’s business
assets (including farmland, buildings, equipment,
and inventory).
18 | FINANCIAL BENCHMARKS FOR DIRECT-MARKET VEGETABLE FARMS
Insights
MOST DIRECT-MARKET VEGETABLE FARMERS
ARE NOT EARNING A MIDDLE–CLASS INCOME
Some direct-market vegetable farmers have reached various degrees
ofnancialstability.Most,however,aren’tearningamiddle-classincome—
or even a living wage.
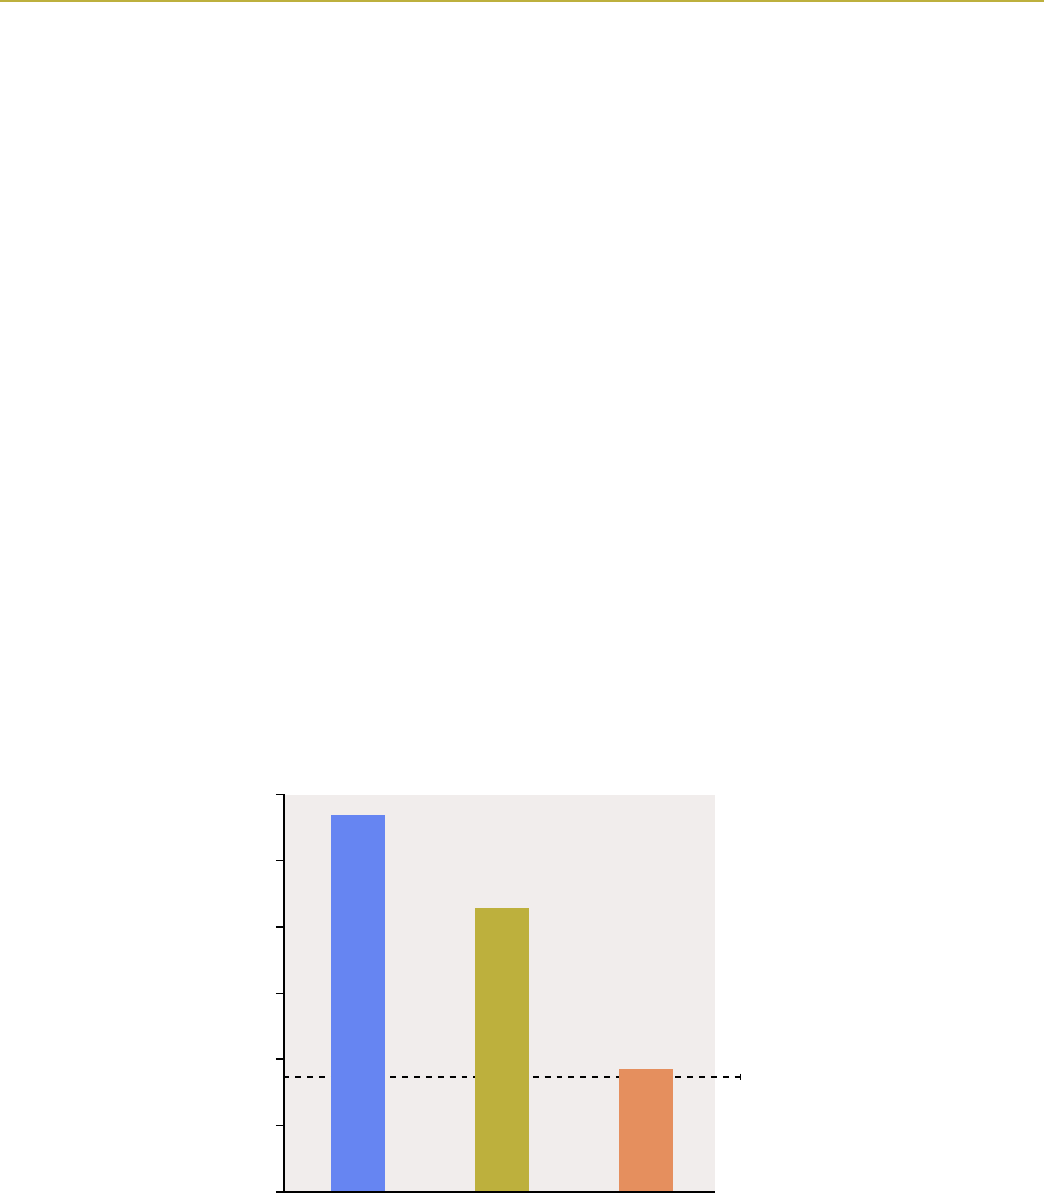
A quarter of farms are earning net incomes greater than the Pennsylvania
median household income of $56,951. For most, though, the median net farm
business income of $18,549 is substantially less than the Pennsylvania median
household income. For context, the statewide poverty rate in Pennsylvania for
a two-person household is $17,420.
4
Additionally, 71% of participating farms had net farm business incomes
less than the average Pennsylvania farm income of $42,875. Notably, however,
roughly 55% of all Pennsylvania farms operated at a net loss in 2017 (the date
of the most recent Census of Agriculture), while 82% of the vegetable farms
in our study showed positive incomes each year.
5
FIGURE 4. MEDIAN NET INCOMES FOR PA
HOUSEHOLDS, FARMS & STUDY PARTICIPANTS
Median net incomes, $1,000s
0 10 3020 40 50
All PA households
60
All PA farms Study participants
PA poverty line
PASA SUSTAINABLE AGRICULTURE | 19
Direct-market vegetable farms typically utilize a variety
of sales channels, including farmers markets; CSA
programs; direct wholesale to restaurants, grocery
stores, and institutions; and other direct markets
including on-farm and online stores. Some direct-
market farms also use wholesale-to-intermediary
channels such as produce auctions, food service
companies, and marketing co-ops. Are some of these
marketchannelsconsistentlymoreprotablethan
others?
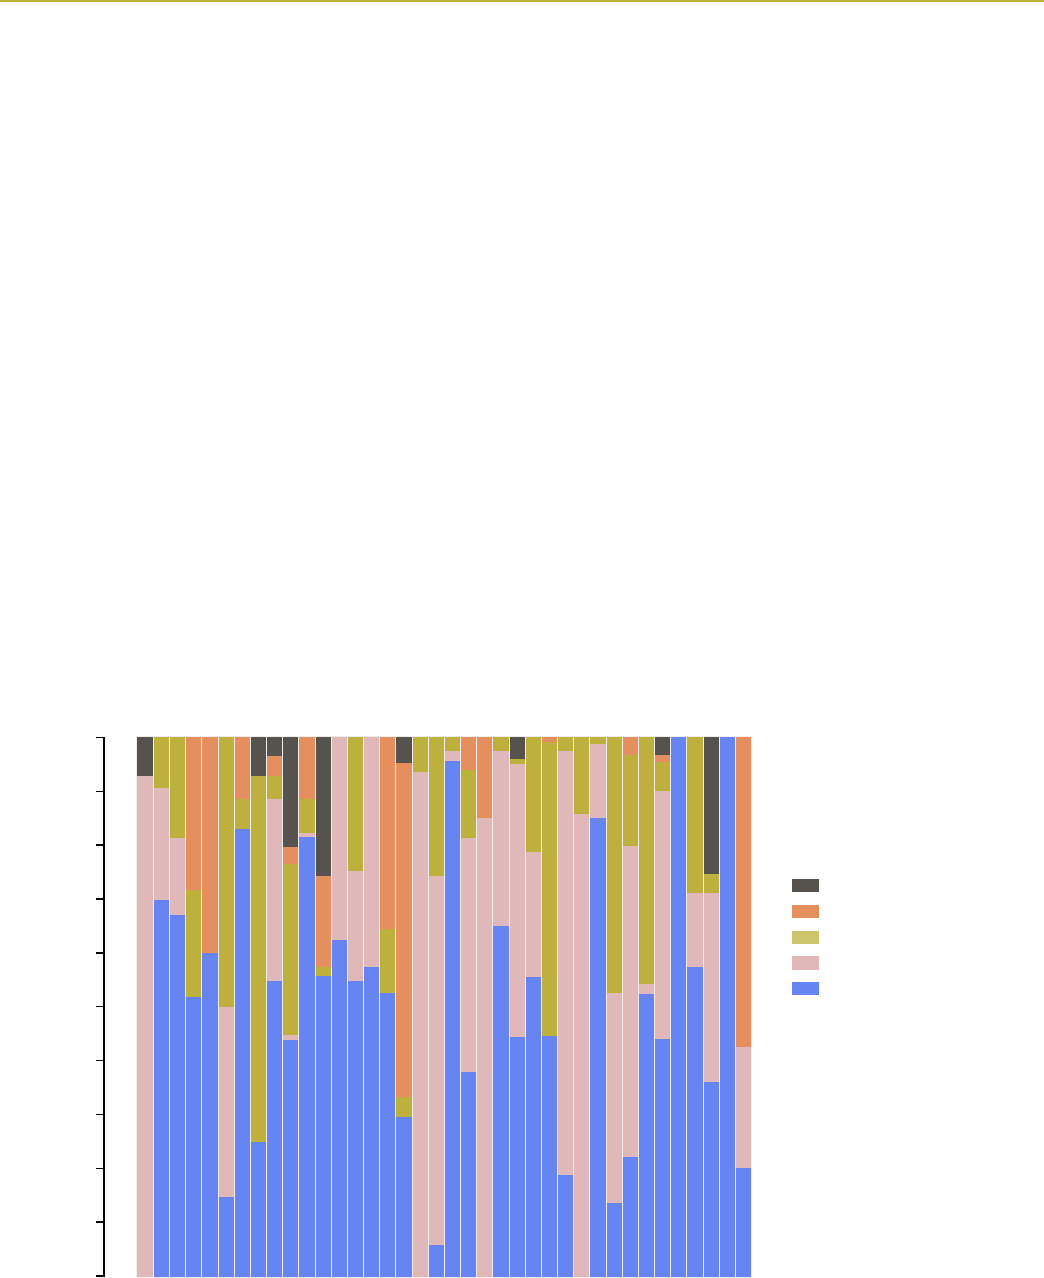
Figure 5 shows each participating farm’s gross
vegetable enterprise revenue (Table 2), allocated by
its percentage of sales through CSAs, farmers markets,
direct wholesale, other direct markets (often on-farm
and online stores), and wholesale to intermediaries.
Eachfarmisrankedbyprotability,asmeasuredby
their vegetable enterprise net income to revenue
ratio (Table 7).
The chart suggests that no single direct-market
channelisconsistentlymoreprotablethanothers.We
foundprotablefarmsusingamixofmarketchannels.
Wealsofoundprotablefarmsprimarilyfocusedon
selling their products through CSAs or farmers markets.
Conversely,wealsofoundlessprotablefarmsusing
amixofmarketchannels,andlessprotablefarms
focused on single market channels. For context, the
mostprotablevegetableenterpriseinourstudyhad
an average net income of $192,525 while the least
protablevegetableenterprisehadanaveragenet
income of -$42,408.
Vegetable enterprises ranked by net income
NO SINGLE DIRECT-MARKET CHANNEL
OUTPERFORMED ALL OTHERS
FIGURE 5. NET VEGETABLE ENTERPRISE INCOME & MARKET CHANNEL COMPOSITION
Data are the mean values for each
farm, averaged for all years over
2017–19 for which we have data for
that farm.
% Intermediary wholesale
% Other direct markets
% Direct wholesale
% Farmers markets
% CSA
Vegetable enterprises gross revenues,
% by market channel
0 10 10020 30 40 50 60 70 80 90
MostprotableLeastprotable
20 | FINANCIAL BENCHMARKS FOR DIRECT-MARKET VEGETABLE FARMS
Data are the mean values for each farm, averaged for all years over 2017–19 for which we have data for that farm.
Farms in our study were growing vegetables across
a wide range of scales, from approximately half an
acre to 90 acres (with a median of four acres). To
explorerelationshipsbetweenscaleandprot,we
reviewed both the vegetable enterprise net income
to revenue ratio (Table 7), which measures the
proportion of revenue that farmers are able to keep,
and the vegetable enterprise net income (Table 4),
which measures the net amount that farmers earn from
vegetables.
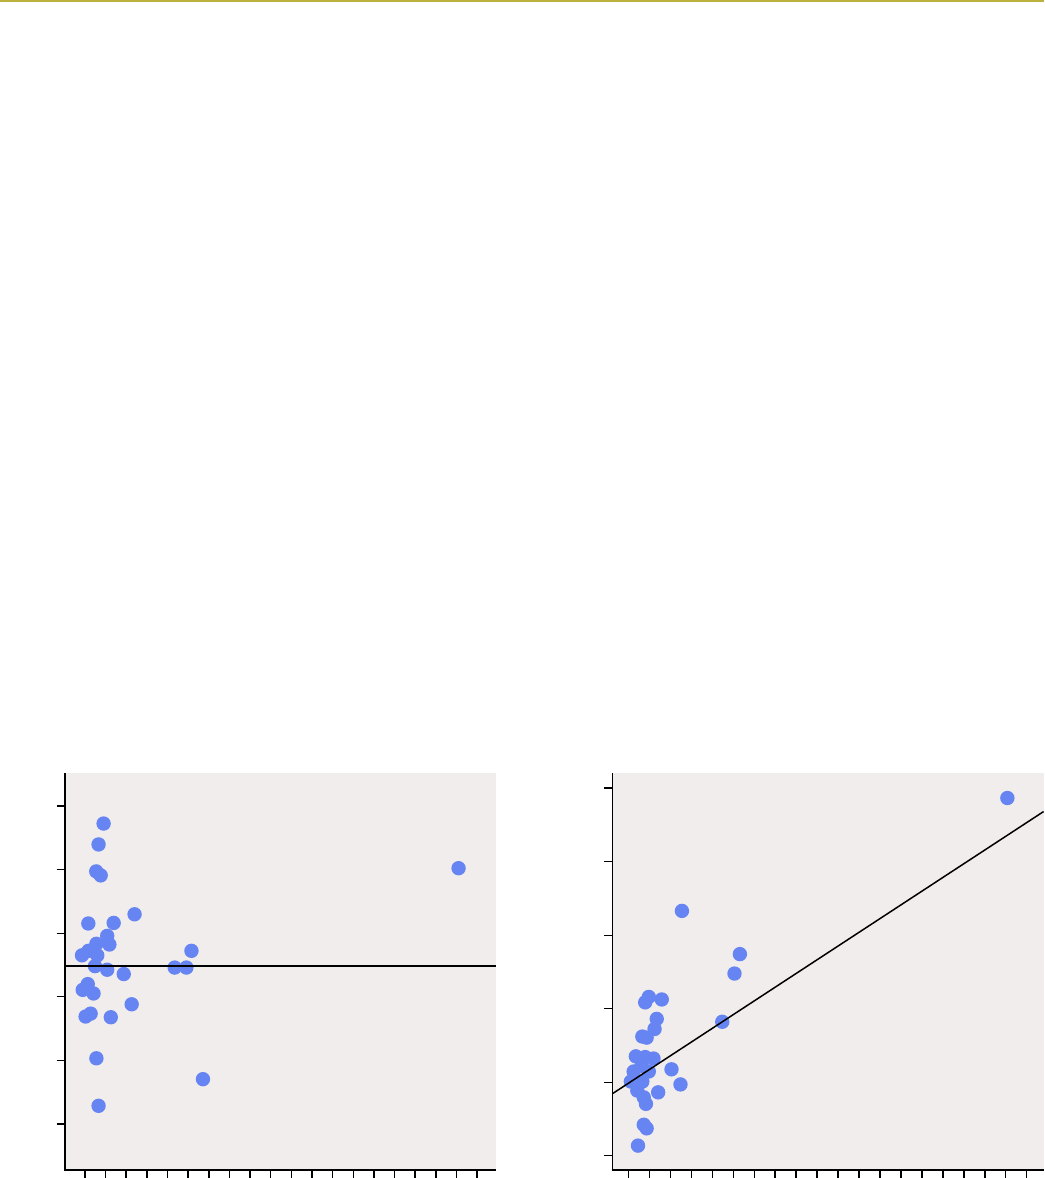
We did not see a consistent correlation between
the number of acres in vegetable production and the
vegetable enterprise net income to revenue ratio
(Figure 6A). While there is considerable variation across
the median (the horizontal line), the lack of a clear
correlation suggests that farmers can achieve similar
protmarginsacrossarangeofproductionscales.
In other words, smaller farmers are not consistently
moreorless“efcient”atearningincomethanlarger
farmers.
At the same time, there is a clear correlation
between the number of vegetable acres in production
and vegetable enterprise net income (Figure 6B).
Although there is also considerable variation in this
pattern, the trend line suggests that for larger farms,
the farm owners and business partners are able to draw
larger incomes from their vegetable enterprises. While
scaling up acres in vegetable production is rarely easy
and not always desirable, these data do suggest that
bigger scales can lead to higher incomes for farmers.
FIGURE 6A. VEGETABLE ENTERPRISE NET INCOME
TO REVENUE RATIO RELATED TO ACRES IN
VEGETABLE PRODUCTION
Veg enterprise net income to revenue ratio, %
Acres in vegetable production
-40 -20 200 40 60
0 10 20 30 40 50 60 70 80 90
FIGURE 6B. VEGETABLE ENTERPRISE NET INCOME
RELATED TO ACRES IN VEGETABLE PRODUCTION
Veg enterprise net income, $1,000s
Acres in vegetable production
0 10050 150 200
0 10 20 30 40 50 60 70 80 90
-50
LARGER PRODUCTION SCALES BRING HIGHER INCOMES
PASA SUSTAINABLE AGRICULTURE | 21
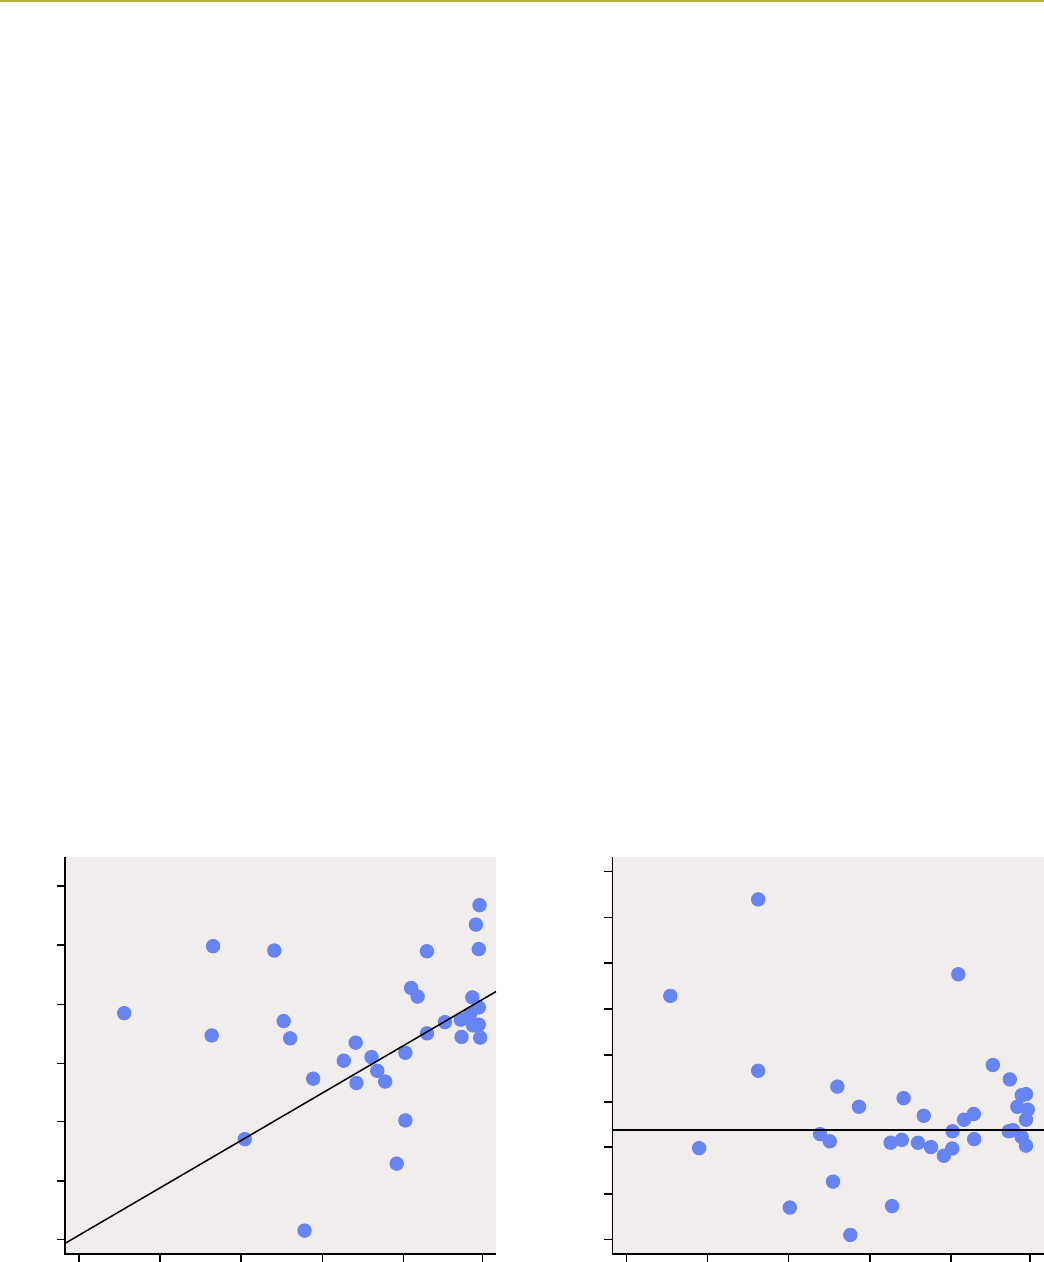
Do farms that primarily focus on growing vegetables
make more or less money than farms that diversify into
other enterprises? Based on the vegetable enterprise
net income to revenue ratio (Table 7), we found
that farms with a high degree of focus in vegetable
productiontendedtobemoreprotableintheir
vegetable enterprise (Figure 7A).
Althoughwefoundsignicantvariation,farmswith
90% or more of their revenue coming from vegetables
grown on their farm showed some of the highest
vegetable enterprise net income to revenue ratios
in our cohort. This trend suggests that farmers who
focusongrowingvegetablescanbuildefcienciesin
their operations that farm businesses with more diverse
revenue streams may be less likely to develop.
At the same time, we found several examples of
protablefarmsthatearnedasignicantpercentageof
their revenue through enterprises other than vegetables
(Figure 7B). While the relationship is not statistically
signicant,someofthemostprotablefarmsinour
study made more than 20% of their revenue from other
enterprises. The most common enterprise other than
vegetables in our cohort was reselling products grown
or raised on other local farms.
This suggests that reselling can be a valuable
strategy for increasing farm business net income
(Table 11). By offering a greater range of livestock
products, fruit, and vegetables grown or raised on
other local and sustainable farms, reselling can help
attract and retain customers. Collaborating with
partnerfarmsthataremoreefcientproducersof
supplementary products can also often help farmers
capture a higher margin with resale items than
comparable items grown on their own farm.
Otherprotableenterprisesamongparticipating
farms included nursery and ornamental plants; on-farm
events and agritourism; and pastured livestock,
including sheep, pigs, and poultry.
Data are the mean values for each farm, averaged for all years over 2017–19 for which we have data for that farm.
FIGURE 7A. VEGETABLE ENTERPRISE NET INCOME
TO REVENUE RATIO RELATED TO CONCENTRATION
IN VEGETABLE ENTERPRISE
Veg enterprise net income to revenue ratio, %
% Farm business revenues from veg enterprise
0 20 40 60 80 100
-40 0-20 40 60-60 20
FIGURE 7B. FARM BUSINESS NET INCOME RELATED
TO CONCENTRATION IN VEGETABLE ENTERPRISE
Farm business net income, $1,000s
% Farm business revenues from veg enterprise
-50 500 100 150-100
0 20 40 60 80 100
200 250 300
FARMS THAT FOCUS ON VEGETABLES MAKE MORE MONEY ON VEGETABLES—
BUT MAY MISS OUT ON HIGHER NET INCOMES FROM OTHER ENTERPRISES
22 | FINANCIAL BENCHMARKS FOR DIRECT-MARKET VEGETABLE FARMS
Farmers in our study possessed a wide range of
vegetable production and business management
experience. The newest participating farm started in
2017, while other businesses in our study had existed
for more than 40 years.
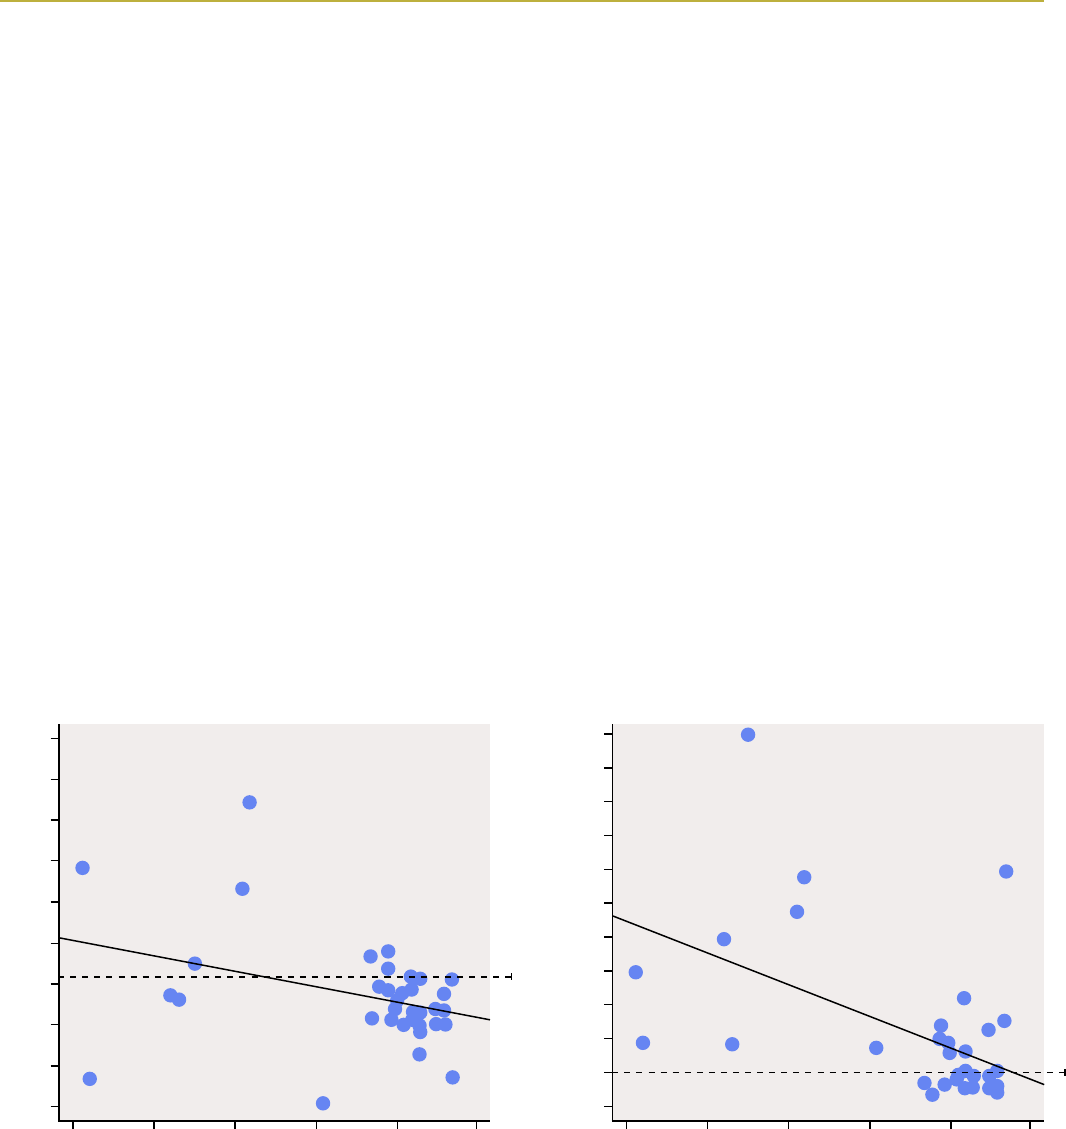
For the farm business as a whole, there is a clear
relationship between a farm’s number of years in
business and its farm business net income ( Table
11). In Figure 8A we can see that although there is
considerable variation, the trend line in solid black
suggests that it can take approximately 10 years for a
farm business to achieve a farm business net income
equal to the 2017 Pennsylvania median household
income of $56,951, represented by the dotted line.
We also found a clear pattern between the number
of years a farm was in business and its farm business
equity, which is a farm’s total value of assets minus
its debts, as shown in Figure 8B. Many farmers build
considerable equity in their business as they continue
farming—most farms that had been in business for 10
or more years had considerably more equity in their
business than the median 2017 Pennsylvania household
net worth of $105,594 (represented by the dotted line).
Data are the mean values for each farm, averaged for all years over 2017–19 for which we have data for that farm.
FARMS STEADILY INCREASED INCOME AND EQUITY OVER TIME
FIGURE 8A. FARM BUSINESS NET INCOME RELATED
TO NUMBER OF YEARS IN BUSINESS
Farm business net income, $1,000s
Farm business start year
1970 1980 1990 2000 2010 2020
-50 500 150 200-100 100 250 300 350
2017 PA median household income
FIGURE 8B. FARM BUSINESS EQUITY RELATED
TO NUMBER OF YEARS IN BUSINESS
Farm business equity, $1,000s
Farm business start year
300 1,100700 1,500 1,900-100
1970 1980 1990 2000 2010 2020
2017 PA household net worth
PASA SUSTAINABLE AGRICULTURE | 23
Trends: 2017–19
A subset of 19 farms participated in our study over three years between 2017
and 2019. By monitoring these farms over multiple years, we’re offered a unique
look at how farm business outcomes might change over time.
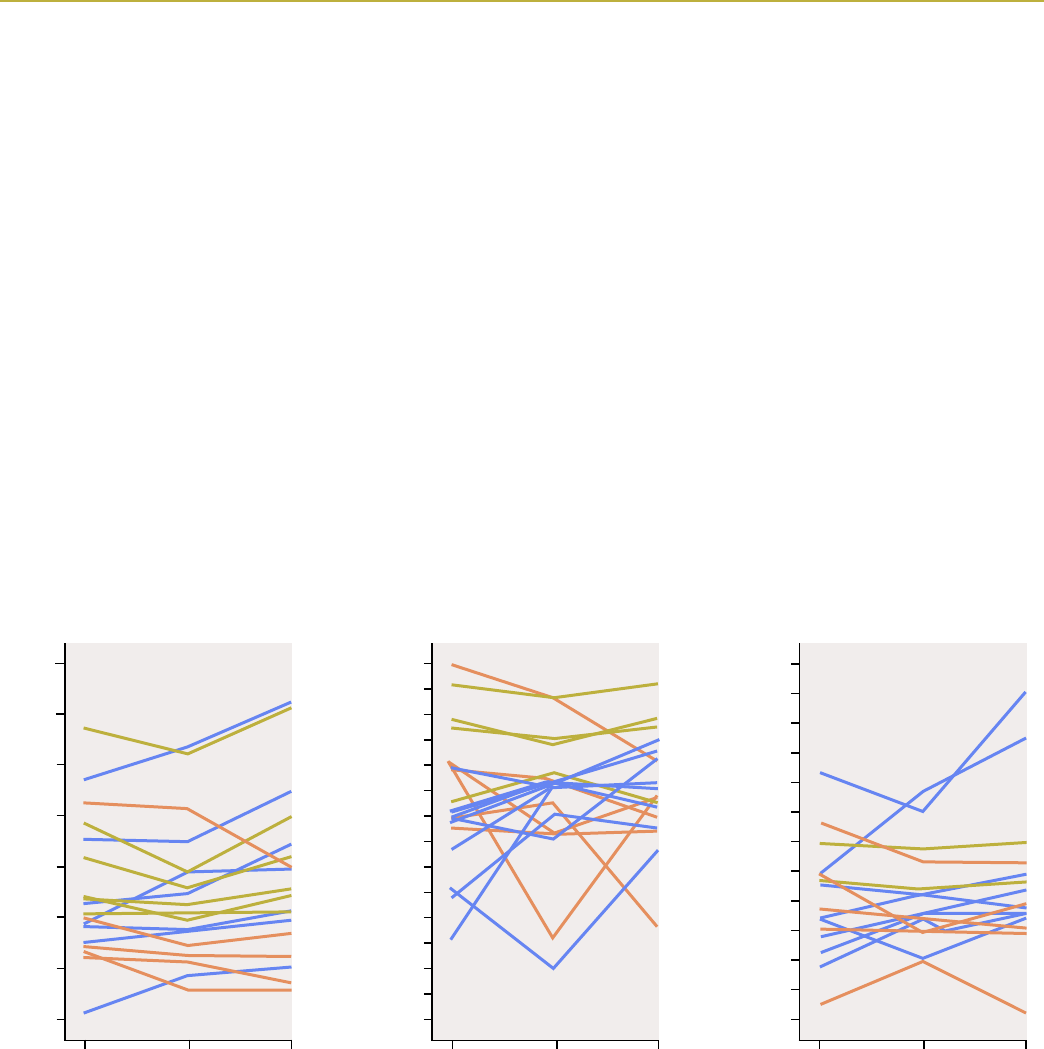
In Figures 9A–C we show year-to-year trends for three key indicators: gross
vegetable enterprise revenue per acre (Table 3), vegetable enterprise
income to revenue ratio (Table 7), and vegetable enterprise net income
(Table 4). These data suggest that most farms improved or maintained their
nancesoverthethreeyearstheyparticipatedinourstudy.
For each indicator, each line represents an individual farm.
Blue line: Farm that showed a 10% or greater increase
Orange line: Farm that showed at least a 10% decrease
Green line: Farm with little change
FIGURE 9B. VEGETABLE
ENTERPRISE NET INCOME
TO REVENUE RATIO,
2017–19
Veg net income to revenue ratio, %
2017 2018 2019
-70 -50 -10-30 10 30
50
70
Gross veg enterprise revenues per acre, $1,000s
2017 2018 2019
0 10 3020 40 50
60
70
FIGURE 9A. TRENDS
IN GROSS VEGETABLE
ENTERPRISE REVENUE
PER ACRE, 2017–19
Veg net income, $1,000s
2017 2018 2019
-60 -20 6020 100 140
180
FIGURE 9C. VEGETABLE
ENTERPRISE NET
INCOME, 2017–2019

24 | FINANCIAL BENCHMARKS FOR DIRECT-MARKET VEGETABLE FARMS
As shown in Figure 9A, seven of the 19 farms increased their gross
vegetable enterprise revenue per acre by more than 10% over three years,
while six roughly stayed the same.
Trends in vegetable enterprise net income to revenue ratio, as shown
in Figure 9B, were more variable. Two farms showed very pronounced dips in
2018, but by 2019 one of these had achieved a net increase while the other
recovered to a more modest loss. By 2019, nine had substantially increased
their ratio, while six had decreases of 10% or more relative to 2017.
As shown in Figure 9C, 12 out of 19 farms increased their vegetable
enterprise net income by more than 10% while two stayed roughly the same.
One farm with more than 12 acres in vegetable production increased its net
income by more than $92,000 over this period, achieved by simultaneously
expanding its vegetable acres in production; improving its equipment and
infrastructure;andfulllinglargewholesalecontractstointermediaries.
The 2018 season was exceptionally notable for the severe weather in the
Mid-Atlantic region, especially during the late summer and fall months. Annual
precipitation was 50% above average in much of the region, leading to many
countiesbeingdeclaredfederaldisasterareasduetopersistentoods.Many
farmers in our study reported major drops in yields and even abandoned some
fall crops.
Fortunately, despite these setbacks, our data suggest that these farms’
business models were resilient against disastrous weather. Most farms
maintained consistent net incomes in 2018, while some even improved their
net incomes. Anecdotally, many farms reported that their CSA programs were
critical to this resilience—prepaid spring CSA revenue allowed them to maintain
cashowdespiteloweryields.In2019,mostoftheirCSAcustomersreturnedto
enjoy renewed availability and diversity of produce in their subscriptions.
The 2018 season was exceptionally notable for the severe
weather in the Mid-Atlantic region, especially during the
late summer and fall months. Fortunately, despite these
setbacks, our data suggest that these farms’ business
models were resilient against disastrous weather. Most
farms maintained consistent net incomes in 2018, while
some even improved their net incomes.
“

PASA SUSTAINABLE AGRICULTURE | 25
income is the product of production scale, the value
ofvegetablesproducedperacre,andtheefciency
at which a farm can reduce costs and keep more of its
revenue as income.
Three pathways to higher incomes
For all three years of the study combined (2017-2019),
the median net farm business income (Table 11) for
all participating farms was $18,549, which is well below
the 2017 Pennsylvania median household income of
$56,951. In terms of return on farm owner labor
(Table 13), the median was only $11,684 per full-time
equivalent. While wealth accumulated in assets over
time adds a level of nuance (Figure 7B), most of the
farmers in our study worked long hours for very little
income.
These are sobering realities, but our study points
to several strategies that farmers can pursue to
improve their bottom lines. To demonstrate these
strategies, we created a simple exercise that compares
three different business models generating a net
vegetable enterprise income (Table 11) of $56,951—
the Pennsylvania median income. In each scenario,
Vegetable enterprise net income = vegetable acres
* gross vegetable enterprise revenue per acre *
vegetable enterprise net income to revenue ratio
The baseline scenario in our exercise shows a farm
with a vegetable enterprise net income currently at
$34,486 and assumes 2019 median values for vegetable
enterprise gross revenue per acre and the vegetable
enterprise net income to revenue ratio, for a farm with
10 acres in vegetable production. Table 15 demonstrates
three ways this farm might increase its income.
TABLE 15. SCENARIOS FOR ACHIEVING A NET INCOME GOAL ($56,951) FROM A VEGETABLE ENTERPRISE
BY INCREASING SCALE, INTENSITY, OR EFFICIENCY
Scenario
SCALE
(acres in
vegetable
production)
INTENSITY
(gross revenue
per acre in
vegetable
production)
EFFICIENCY
(vegetable
net income to
revenue ratio)
Vegetable
enterprise
net income
Baseline 10 $27,589 12.5% $34,486
1. Increase scale 16.5 $27,589 12.5% $56,951
2. Increase intensity 10 $45,561 12.5% $56,951
3. Increase efciency 10 $27,859 20.4% $56,951

26 | FINANCIAL BENCHMARKS FOR DIRECT-MARKET VEGETABLE FARMS
INCREASE SCALE
In scenario 1, we set net revenue per acre and the net income per revenue
ratioatthemedianstudyvaluesof$27,589and12.5%,respectively.Wend
that the farm in this example would need to increase the number of acres in
vegetable production from 10 to 16.5 to meet the net income target with this
business model.
However, if increasing the number of acres in vegetable production isn’t
possible—say, due to a limited amount of land available—a farmer might
consider the next two pathways toward higher income.
INCREASE INTENSITY
In scenario 2, our example farm focuses on increasing the amount of revenue it
earns in vegetables per acre. Perhaps the farm adjusts its crop plan to focus on
growing higher value crops with quicker rotations.
By increasing its gross vegetable enterprise revenue per acre from
$27,589 to $45,561, our example farm can meet its income goal. In fact, in
2019, 13% of farms in our study realized a gross revenue per acre in vegetable
production above $45,000, illustrating that this strategy can be feasible with
the right mix of crops and market channels.
INCREASE EFFICIENCY
Inscenario3,ourexamplefarmworkstoincreaseitscostefciency,perhaps
by controlling spending associated with payroll, supplies, and fuel. The farm
increases its vegetable net income to revenue ratio from 12.5% to 20.4%,
thereby reaching its income goal. In fact, in 2019, 30% of farms in our study
realized a ratio over 20%. Since payroll is typically among the biggest operating
expenses,improvinglaborefciencyandemployeemanagementskillsare
among the most important aspects of this business strategy.

PASA SUSTAINABLE AGRICULTURE | 27
Public support for
fair farm incomes
Of course, expanding scales, boosting revenue, and cutting costs are much
easier said than done. Only approximately 25% of farms in our study were able
to achieve net incomes at or above the median Pennsylvania household income
($56,951); most farms’ net incomes were less than half of this. The farmers
who did achieve higher incomes typically attributed their success to a mix of
hard work and good fortune—such as access to lucrative markets or reliable
farmland arrangements—that other farmers might not have.
Allofthefarmersparticipatinginourstudywanttooperateprotable,
self-sustainingbusinesses.Yetthesoberingnancialbenchmarkspresentedin
this report are consistent with persistent structural challenges in the agricultural
industry that negatively impact small- and medium-scale farms. Creating and
expanding public programs will be necessary to help direct-market vegetable
farmers continue their essential work providing fresh, nutritious food for their
communities. These programs should focus on equitably increasing farmland
access, improving market opportunities, encouraging workforce development,
reducingnancialrisk,andrewardingconservationbestpracticessuchas
building soil health, protecting wildlife, and improving water quality.
Only approximately 25% of farms in our study were able to
achieve net incomes at or above the median Pennsylvania
household income ($56,951); most farms’ net incomes were
less than half of this.
“

28 | FINANCIAL BENCHMARKS FOR DIRECT-MARKET VEGETABLE FARMS
Conclusion
This report shares a comprehensive and unique set of business benchmarks
for an important, growing sector of the agricultural landscape: direct-market,
diversiedvegetablefarms.Ourdatashowthatwhilesomefarmsparticipating
inourstudyhaveachievedarangeofdegreesofnancialstability,mostfarms
in this sector are earning incomes substantially below the household—and
farm—medians for Pennsylvania.
Ourdatashowthatsuccessfulfarmsutilizearangeofspecicdirect-market
channels—farmers markets, CSAs, on-farm stores, and direct wholesale—and
that no one channel clearly outperforms all others. We also found that income
andequitysteadilyincreasewithfarmerexperience,suggestingthatnancial
benchmarks may improve as farms in our cohort continue to evolve and mature.
Our study points to increasing production scale, revenue per acre, and labor
andcostefciencyaskeypathwaystoimprovingnetincomesamongdirect-
market vegetable farms. While entrepreneurial skill and grit are important,
it is also the case that sustainable, direct-market farmers are providing
valuable public services but retain little compensation from their efforts due
topersistentstructuralbarrierstoachievinglong-termnancialviabilityin
the agriculture industry. New and expanded public programs for equitably
increasing farmland access, improving market opportunities, encouraging
workforcedevelopment,reducingnancialrisk,andrewardingconservation
best practices are needed for these farms to thrive.
The power of this study is that participating farms can more clearly see
therangeofnancialpossibilitiesfortheirbusinessesandconnectwithother
farmers who are navigating similar challenges. Without these data, farmers
areunabletoknowiftheirfarms’nancesarenormaloratypical,andtheyare
unable to gauge if plans for the future may be achievable or unreasonable.
We hope this report offers farmers, farmer organizations, policymakers, and
communitiesvaluableinsightsthatcanbedrawnfromtoimprovenancial
outcomes for direct-market vegetable farms.
Movingforward,wewillcontinuetocollectdirect-marketnancial
benchmarks with our growing cohort of Mid-Atlantic vegetable farmers. We
are also working with peer organizations in New England (Community Involved
in Sustainable Agriculture) and the Carolinas (Carolina Farm Stewardship
Association) to build new cohorts of direct-market vegetable farmers in other
regions. We also plan to use our data to provide a detailed look at how the
COVID-19 pandemic affected marketing, labor, and incomes on farms that have
participated in our study over multiple years.

PASA SUSTAINABLE AGRICULTURE | 29
We always welcome direct-market vegetable farms
to join our ongoing study. Participating farms receive
custom nancial benchmark reports and access to
a learning community of their peers.
Learn more at pasafarming.org/research or contact
us at research@pasafarming.org if you are interested
in joining.

30 | FINANCIAL BENCHMARKS FOR DIRECT-MARKET VEGETABLE FARMS
References
1. National Agricultural Statistics Service (NASS) (2016). USDA Releases Results
of First Local Food Marketing Practices Survey.
https://www.nass.usda.gov/Newsroom/archive/2016/12_20_16.php
2. Kolbe, L. (2017). Whole Farm Financial Project Year 2 — An Analysis of 2014
Financials. Practical Farmers of Iowa, Ames. IA.
https://practicalfarmers.org/research/whole-farm-nancial-project-year-2-an-
analysis-of-2014-nancials/
3. Hendrickson, J. A. (2005). Grower to grower: Creating a livelihood on a fresh
market vegetable farm. Center for Integrated Agricultural Systems. Madison, WI.
https://cias.wisc.edu/wp-content/uploads/sites/194/2008/07/grwr2grwr1.pdf
4. Pennsylvania Department of Human Services (2020). Federal Poverty Income
Guidelines for 2020, 50 Pa.B. 3672.
https://www.pacodeandbulletin.gov/Display/pabull?le=/secure/pabulletin/data/
vol50/50-29/951.html
5. National Agricultural Statistics Service (NASS) (2019). Census of Agriculture —
2017 Census Full Report. Washington, DC.
https://www.nass.usda.gov/Publications/AgCensus/2017/index.php

PASA SUSTAINABLE AGRICULTURE | 31