An Economic Analysis of
Utah’s Direct Selling Industry
Utah’s established direct selling industry anchored over 38,000
well-paying jobs and added signicantly to state and local tax
revenues as part of its 2020 statewide economic impacts.
August 2022
411 East South Temple Street
Salt Lake City, Utah 84111
801-585-5618
I
gardner.utah.edu
Levi Pace, Ph.D.
Senior Research Economist

Table of Contents
Analysis in Brief .......................................1
Section 1: Utah Economic Impacts ......................2
Section 2: Industry Employment and Wages .............5
Section 3: Sales at Home and Abroad ...................9
Section 4: Sales Representatives ...................... 11
Section 5: Conventions ............................... 14
Section 6: Research Methods ......................... 16
Figures
Figure 1: Economic Impacts of Utah’s Direct Selling
Industry, 2020 ......................................... 2
Figure 2: Utah Indirect and Induced Employment
Impacts by Sector, 2020 ................................ 3
Figure 3: Direct Selling and Industries With Similar
Employment, 2020 ..................................... 5
Figure 4: Utah Direct Selling Companies by
Segment, 2020 ........................................ 5
Figure 5: Average Annual Wages per Employee, 2020 ..... 5
Figure 6: Utah Direct Selling Companies by Size, 2020 ..... 6
Figure 7: Utah Direct Selling Employment by
Sector, 2020 ........................................... 6
Figure 8: Direct Selling Employment and Wages by
County, 2020 .......................................... 7
Figure 9: Employment and Wages of Selected Direct
Selling Suppliers by Type, 2020 ......................... 7
Figure 10: Direct Selling and Other Utah Exports, 2020 .... 9
Figure 11: Attendance at Selected Direct Selling
Conventions in Utah, 2015–2019 ......................14
Figure 12: Diagram of Fiscal Impact Calculations ......... 20
Tables
Table 1: Utah Direct Selling Industry Components, 2020 ... 2
Table 2: Utah Direct Selling Industry State and Local
Fiscal Impacts, 2020 .................................... 3
Table 3: Direct Selling State Fiscal Impacts in Utah, 2020 ... 3
Table 4: Direct Selling Local Fiscal Impacts in Utah, 2020 .. 4
Table 5: Utah’s Largest Employers in the Direct Selling
Industry, 2020 ......................................... 6
Table 6: Selected Utah Suppliers to Direct Selling
Companies by County, 2020. . . . . . . . . . . . . . . . . . . . . . . . . . . . 8
Table 7: Sales by Destination for Selected Utah Direct
Selling Companies, 2020 ............................... 9
Table 8: Sales Representatives for Selected Utah
Direct Selling Companies, 2020 .......................11
Table 9: Demographics of People Involved in Direct
Selling, 2020 .......................................... 12
Table 10: Selected Conventions Direct Selling Companies
Held in Utah, 2015–2019 ..............................14
Table 11: Annual Attendance at Selected Direct Selling
Conventions in Utah, 2015–2019 ......................14
Table 12: Non-Local Visitor Spending From Selected
Direct Selling Conventions in Utah, 2015–2019 ........15
Table 13: Utah Direct Selling Companies .................17
Table 14: Selected Utah Suppliers to Direct Selling
Companies ...........................................18
gardner.utah.edu
I
August 2022
INFORMED DECISIONS
TM
1
An Economic Analysis of Utah’s Direct Selling Industry
Analysis in Brief
Economic Impacts of Utah’s Direct Selling Industry, 2020
Note: Percentages equal Utah’s total economic impacts from the direct selling industry
divided by total statewide employment and earnings for all industries. Besides the
in-state operations of direct selling companies and selected suppliers, 2020 impacts
incorporate average annual economic activity from direct selling conventions held
between 2015 and 2019.
Source: Kem C. Gardner Policy Institute analysis of data from the Utah Department of
Workforce Services using REMI PI+ economic model
$53,782
$63,652
$0 $20,000 $40,000 $60,000 $80,000
Other Industries
Direct Selling Industry
71.7% 28.3%
35.6% 64.4%
0% 20% 40% 60% 80% 100%
Total Utah
Commodity Exports
Utah Non-Gold
Commodity Exports
Direct Selling Industry Other Industries
Direct impacts
(Direct selling)
Indirect and induced impacts
(Beyond the direct selling industry)
100.0%
($8.8 Billion)
100.0%
($17.7 Billion)
17,487
20,751
$1.329.9
$1,347.4
38,238 jobs
1.8% of Utah
employment
$2,677.3 million
2.2% of Utah
earnings
15 (16%)
4 (4%)
6 (7%)
9 (10%)
18 (20%)
51 (56%)
0 10 20 30 40 50 60
Other Products
Food & Beverages
Essential Oils
Services
Beauty & Fashion
Health & Wellness
15,497
15,828
16,707
16,784
17,487
18,697
19,543
19,891
0 5,000 10,000 15,000 20,000 25,000
Bldg. & Garden Retail
Metal Product Mfg.
Publishing
Federal Military
Direct Selling
Amusement & Rec.
Food Manufacturing
Accommodation
$0.0
$20.0
$40.0
$60.0
$80.0
$100.0
$120.0
$140.0
$160.0
$180.0
$200.0
State Local
$127.1
$64.3
Tax Revenues
Revenues
$191.4
$38.1
$8.5
Government
Operating Expenditures
$46.6
$89.0
$55.8
Net State and
Local Revenue
$144.7
225,155 (71.2%) 90,961(28.8%)
0 100,000 200,000 300,000
Domestic (U.S.) International
316,116
(100.0%)
Exports from Utah Direct Selling Companies, 2020
(Share of Statewide Exports for 10 Direct Selling Companies,
Which Reported a Combined $6.3 Billion in Exports)
Note: Commodities exclude services. Statewide gold exports were $8.9 billion. Trade data
not available for 81 of Utah’s 91 direct selling companies.
Source: Dorsey & Whitney LLP; U.S. Census Bureau, USA Trade Online
$53,782
$63,652
$0 $20,000 $40,000 $60,000 $80,000
Other Industries
Direct Selling Industry
71.7% 28.3%
35.6% 64.4%
0% 20% 40% 60% 80% 100%
Total Utah
Commodity Exports
Utah Non-Gold
Commodity Exports
Direct Selling Industry Other Industries
Direct impacts
(Direct selling)
Indirect and induced impacts
(Beyond the direct selling industry)
100.0%
($8.8 Billion)
100.0%
($17.7 Billion)
17,487
20,751
$1.329.9
$1,347.4
38,238 jobs
1.8% of Utah
employment
$2,677.3 million
2.2% of Utah
earnings
15 (16%)
4 (4%)
6 (7%)
9 (10%)
18 (20%)
51 (56%)
0 10 20 30 40 50 60
Other Products
Food & Beverages
Essential Oils
Services
Beauty & Fashion
Health & Wellness
15,497
15,828
16,707
16,784
17,487
18,697
19,543
19,891
0 5,000 10,000 15,000 20,000 25,000
Bldg. & Garden Retail
Metal Product Mfg.
Publishing
Federal Military
Direct Selling
Amusement & Rec.
Food Manufacturing
Accommodation
$0.0
$20.0
$40.0
$60.0
$80.0
$100.0
$120.0
$140.0
$160.0
$180.0
$200.0
State Local
$127.1
$64.3
Tax Revenues
Revenues
$191.4
$38.1
$8.5
Government
Operating Expenditures
$46.6
$89.0
$55.8
Net State and
Local Revenue
$144.7
225,155 (71.2%) 90,961(28.8%)
0 100,000 200,000 300,000
Domestic (U.S.) International
316,116
(100.0%)
Largest Utah Employers in Direct Selling Industry, 2020
(Companies with at Least 100 Employees)
100 to 249 Jobs 250 to 749 Jobs 750 Jobs or More
ASEA Global 4Life Research doTERRA
LifeVantage Aptive Environmental Nu Skin
Modere Blue Raven Solar USANA Health Sci.
Plunder Design Nature's Sunshine Young Living
SupraNaturals NewAge
Thrive Life Paparazzi Accessories
Unicity International Stampin' Up
Xyngular Younique
Zyia Active
Note: Disclosure limitations prevent the reporting of exact employment counts by
company. In addition, Utah employment at direct selling companies does not include
independent sales representatives.
Source: Utah Department of Workforce Services, FirmFind
Utah’s established direct selling industry anchored over
38,000 well-paying jobs and added signicantly to state and
local tax revenues as part of its 2020 statewide economic
impacts. Direct selling companies market and distribute
products through independent sales representatives and their
personal networks. Utah is a global hub for the direct selling
business model. The industry comprises 91 direct selling
companies and 66 key suppliers. Ten of these direct selling
companies with Utah headquarters provided more than $10.3
billion in goods and services to their customers around the
world, 6.1% of industry sales from all states and countries.
Key Findings
• Economic Impacts—The direct selling industry employed
17,487 Utah residents, and industry activity indirectly
supported another 20,751 jobs.
• High Wages—At $63,652 per employee, direct selling
companies paid their Utah employees an average of 18.4%
more than companies in other industries in 2020.
• Exports—International sales of $6.3 billion from selected
direct selling companies in Utah made up 71.7% of the
state’s non-gold commodity exports in 2020.
• Entrepreneurship—In 2020, 10 large direct selling
companies had 21,457 independent sales representatives
in Utah, predominantly women. Their median self-
employment earnings (before expenses) ranged from $70
to $3,000 per year.
• Business Travelers—Out-of-state visitors who attended
direct selling conventions in Utah spent an estimated $41.6
million annually from 2015 to 2019.
August 2022
I
gardner.utah.edu INFORMED DECISIONS
TM
2
A few metrics outline the direct selling industry’s economic
footprint in Utah. In 2020, direct selling companies and
suppliers with headquarters and other oces in the state
provided 17,487 jobs (see Table 1).
1
Economy-wide impacts
from the spending of direct selling companies and their
suppliers and workers included $2.7 billion in earnings, 2.2%
of the state total for all residents, and $182.8 million in annual
state and local tax revenue. Of 91 direct selling companies,
10 responded to a survey for this study and indicated they
collectively provide a self-employment opportunity for more
than 21,000 independent sales representatives in Utah.
2
Before the COVID-19 pandemic, out-of-state visitors spent an
estimated $41.6 million per year while attending direct selling
conventions in Utah. Section 6 lists companies included in the
direct selling industry denition for Utah.
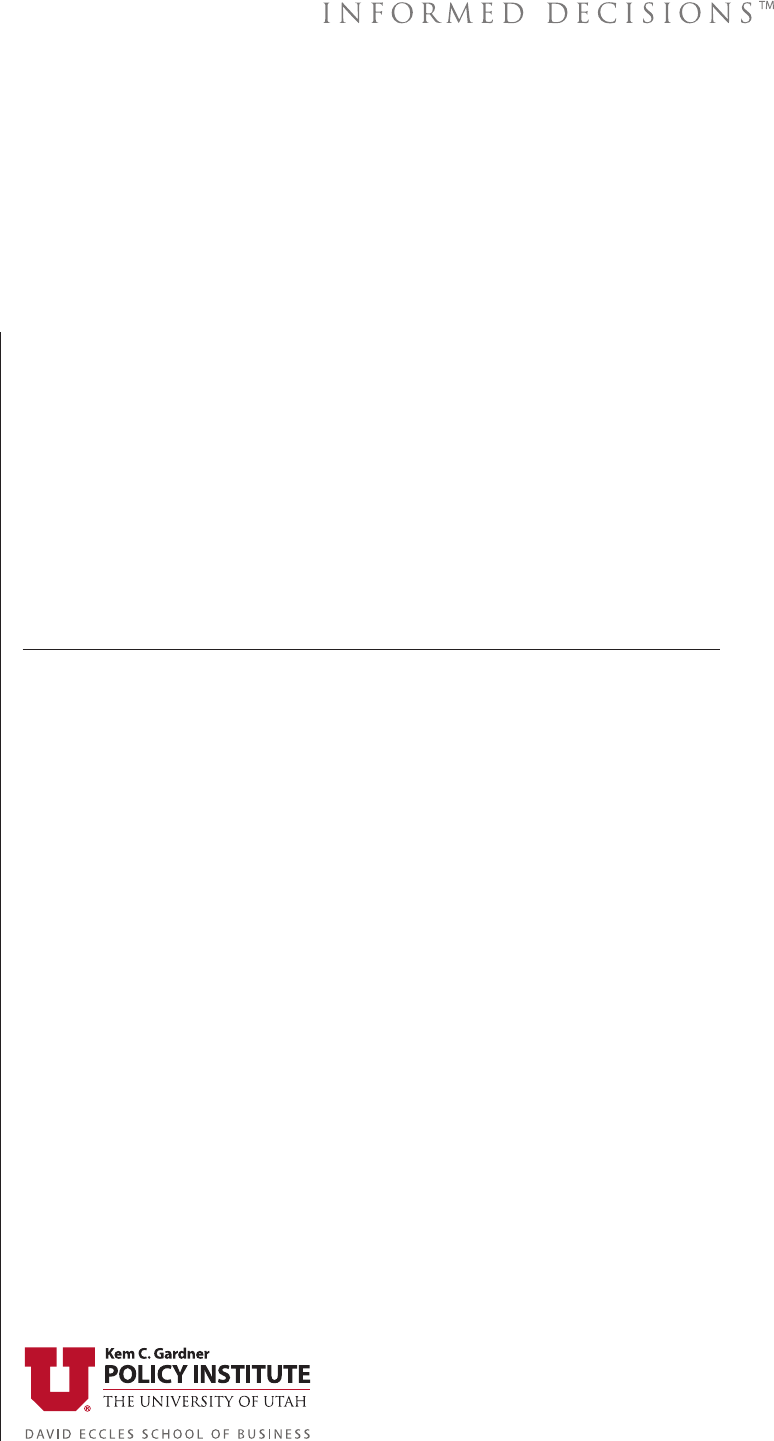
Statewide Economic Impacts: Over 38,000 Jobs Connected
to Direct Selling Industry
In 2020, direct selling companies generated 38,238 Utah
jobs and $2.7 billion in statewide earnings (see Figure 1).
This signicant economic activity constituted 1.8% of Utah
employment in all sectors and 2.2% of its residents’ earnings.
Direct impacts within the direct selling industry were 17,487
jobs and $1.3 billion in earnings.
3
As indirect and induced eects
rippled through interconnected industries and populations,
each direct selling job supported another 1.2 Utah jobs on
average, which added 20,751 jobs to the industry’s employment
impacts. Retail made up nearly one-fourth of direct selling total
employment impacts, followed by manufacturing, construction
and business services (see Figure 2).
4
In each of 13 Utah industries,
at least 1,000 jobs came from direct selling activity in the state.
The economic impacts in this section are based on Utah
employment and wages generated by 157 companies in the
direct selling industry in 2020. Section 2 provides an analysis of
91 direct selling companies and 66 direct selling suppliers. Direct
impacts for this analysis also include estimates of spending
by visitors who attended direct selling conventions, which
were based on historical averages since pandemic measures
limited in-person meetings in 2020 (see Section 5). One
element of the indirect and induced eects Gardner Institute
researchers modeled is the income earned by independent
sales representatives for companies surveyed in this study.
5
Section 1: Utah Economic Impacts
Table 1: Utah Direct Selling Industry Components, 2020
Component Companies Employment (Jobs)
Direct Selling Companies 91 11,678
Selected Suppliers 66 5,312
Convention Visitation NA 497
Total 157 17,487
Note: Of 91 direct selling companies, 10 rms with 6,143 jobs participated in a detailed
survey for this study. Employment at direct selling companies does not include
independent sales representatives. Direct selling companies have many suppliers besides
the 66 within the industry. Economic modeling provides employment estimates but not
company counts for in-state business activity from the spending of out-of-state visitors to
Utah direct selling conventions.
Source: Kem C. Gardner Policy Institute industry denition with input from the Utah
Direct Selling Coalition and Dorsey & Whitney LLP
Figure 1: Economic Impacts of Utah’s Direct Selling
Industry, 2020
Note: Percentages equal Utah’s total economic impacts from the direct selling industry
divided by total statewide employment and earnings for all industries. Besides the
in-state operations of direct selling companies and selected suppliers, 2020 impacts
incorporate average annual economic activity from direct selling conventions held
between 2015 and 2019.
Source: Kem C. Gardner Policy Institute analysis of data from the Utah Department of
Workforce Services using REMI PI+ economic model
$53,782
$63,652
$0 $20,000 $40,000 $60,000 $80,000
Other Industries
Direct Selling Industry
71.7% 28.3%
35.6% 64.4%
0% 20% 40% 60% 80% 100%
Total Utah
Commodity Exports
Utah Non-Gold
Commodity Exports
Direct Selling Industry Other Industries
Direct impacts
(Direct selling)
Indirect and induced impacts
(Beyond the direct selling industry)
100.0%
($8.8 Billion)
100.0%
($17.7 Billion)
17,487
20,751
$1.329.9
$1,347.4
38,238 jobs
1.8% of Utah
employment
$2,677.3 million
2.2% of Utah
earnings
15 (16%)
4 (4%)
6 (7%)
9 (10%)
18 (20%)
51 (56%)
0 10 20 30 40 50 60
Other Products
Food & Beverages
Essential Oils
Services
Beauty & Fashion
Health & Wellness
15,497
15,828
16,707
16,784
17,487
18,697
19,543
19,891
0 5,000 10,000 15,000 20,000 25,000
Bldg. & Garden Retail
Metal Product Mfg.
Publishing
Federal Military
Direct Selling
Amusement & Rec.
Food Manufacturing
Accommodation
$0.0
$20.0
$40.0
$60.0
$80.0
$100.0
$120.0
$140.0
$160.0
$180.0
$200.0
State Local
$127.1
$64.3
Tax Revenues
Revenues
$191.4
$38.1
$8.5
Government
Operating Expenditures
$46.6
$89.0
$55.8
Net State and
Local Revenue
$144.7
225,155 (71.2%) 90,961(28.8%)
0 100,000 200,000 300,000
Domestic (U.S.) International
316,116
(100.0%)
What is Direct Selling?
Direct selling is unique among retail channels because
of the way in which products and services are marketed
to customers. Instead of relying on traditional retail
outlets or online marketplaces, direct selling companies
maintain a sales force of independent entrepreneurs.
Companies market a wide variety of goods and services,
such as nutritional supplements, essential oils, cosmetics,
sportswear, jewelry, cookware, housewares, energy, and
insurance. Sales representatives of direct selling companies
may market products or services through one-to-one
communication, in-home demonstrations, or social media
sharing. With U.S. roots in the late nineteenth century, the
industry now serves markets around the world.
6
gardner.utah.edu
I
August 2022
INFORMED DECISIONS
TM
3
Figure 2: Utah Direct Selling Economic Impacts by
Sector, 2020
(Jobs Generated by the Direct Selling Industry)
Note: Total employment impact of 38,238 jobs includes direct selling companies, selected
suppliers and in-state industry conventions (17,487 jobs), as well as indirect and induced
impacts outside the direct selling industry (20,751 jobs).
Source: Kem C. Gardner Policy Institute analysis of data from the Utah Department of
Workforce Services using REMI PI+ economic model
17 (19%)
10 (11%)
20 (22%)
12 (13%)
13 (14%)
10 (11%)
4 (4%)
3 (3%)
2 (2%)
0 5 10 15 20 25
Less than 5
5 to 9
10 to 19
20 to 49
50 to 99
100 to 249
250 to 499
500 to 1,499
1,500 and above
Companies
Jobs
14,925
15,497
15,828
16,707
16,784
17,487
18,697
19,543
19,891
20,077
20,925
0 5,000 10,000 15,000 20,000 25,000
Misc. Store Retail
Bldg. & Garden Retail
Metal Product Mfg.
Publishing
Federal Military
Direct Selling
Amusement & Rec.
Food Manufacturing
Accommodation
Arts & Sports
Agriculture
$53,891
$53,782
$63,652
$0 $20,000 $40,000 $60,000 $80,000
All Industries
Other Industries
Direct Selling Industry
177
490
1,063
1,258
1,563
1,842
2,023
2,219
2,359
2,434
2,571
2,994
3,418
4,715
9,112
0 2,000 4,000 6,000 8,000 10,000
Natural resources
Information services
Other services
Finance & insurance
Government
Real estate
Professional services
Leisure & hospitality
Wholesale trade
Health & education
Transport. & utilities
Business services
Construction
Manufacturing
Retail trade
2
2
20
51
69
88
104
843
1,200
1,400
1,946
5,953
0 1,500 3,000 4,500 6,000
Real estate
Other services
Finance & insurance
Professional services
Construction
Health & education
Information services
Business services
Transport. & utilities
Wholesale trade
Manufacturing
Retail trade
$540.7
(67.4%)
8,614
(73.8%)
$223.7
(27.9%)
2,357
(20.2%)
$38.2
(4.8%)
707
(6.1%)
0% 20% 40% 60% 80% 100%
Wages
($ Millions)
Employment
(Jobs)
Utah Salt Lake Other Counties
$155.1
(55.6%)
3,497
(65.8%)
36
(54.5%)
$86.2
(30.9%)
1,136
(21.4%)
21
(31.8%)
$37.6
(13.5%)
679
(12.8%)
9
(13.6%)
0% 10% 20% 30% 40% 50% 60% 70% 80% 90% 100%
Wages
($ Millions)
Employment
(Jobs)
Number of
Companies
Manufacturing Services Ingredients
66
(100.0%)
5,312
(100.0%)
$278.9
(100.0%)
4,336
(6.9%)
21,682
(6.9%)
40,695
(64.4%)
203,473
(64.4%)
18,192
(28.8%)
90,961
(28.8%)
0.0% 20.0% 40.0% 60.0% 80.0% 100.0%
Average
Annual
Five-Year
Total
Utah Other States (U.S.) International
316,116
(100.0%)
63,223
(100.0%)
Economic Impact Terms
Employment is a measure of the average number of full-time
and part-time jobs held by employees and self-employed
workers. Companies report their employment to the Utah
Department of Workforce Services by place of work, not by
place of residence.
Wages represent the amount companies pay their employ-
ees on an hourly or salary basis. Employee benets and
self-employment income are not included in wages; these
forms of worker income are part of personal income.
Earnings consist of employee compensation and propri-
etors’ income from self-employment. Employee compen-
sation is the sum of wage and salary disbursements, and
supplements to wages and salaries (employee benets).
Economic impacts refer to the economic activity in a geo-
graphic region generated by a given source—in this case,
the direct selling industry. The Gardner Institute estimated
four components: direct impacts, which involve employee
compensation and other spending by companies in Utah's
direct selling industry; indirect impacts, which include the
relevant portion of spending at companies that provide
inputs to companies in the direct selling industry; induced
impacts, which include the household spending of direct
selling industry employees and the relevant portion of
spending by workers at companies that are part of the indi-
rect impacts; and scal impacts, which include tax revenue
and government expenditures associated with the com-
bined direct, indirect, and induced impacts.
Fiscal Impacts: Direct Selling Companies Generate $191.4
Million in State and Local Tax Revenue
Taxable economic activity connected to direct selling
companies helps fund state and local governments, including
schools. The Gardner Institute estimated government revenues
generated by the direct selling industry’s economic impacts
in Utah; in 2020, government entities received an estimated
$191.4 million in tax revenues from the economic activity
associated with the 38,238 jobs that the industry created or
indirectly sustained (see Table 2).
7
These revenues far exceeded
government expenses, estimated at $46.6 million, for services
to residents whose jobs depended on direct selling companies.
The net scal impact was a $144.7 million annual ow.
At the state level, 2020 net tax revenue from direct selling
industry activity in Utah was $89.0 million (see Table 3). An
estimated 91.3% of $127.1 million in state revenue came
from sales ($57.2 million) and personal income taxes ($58.8
million). Those who paid these taxes included direct selling
employees, independent sales representatives and workers in
other industries supported by the direct selling industry. The
remaining 8.7% ($11.1 million) of state revenue came from
corporate income taxes paid by direct selling companies and
other companies that were part of the industry’s indirect and
induced impacts.
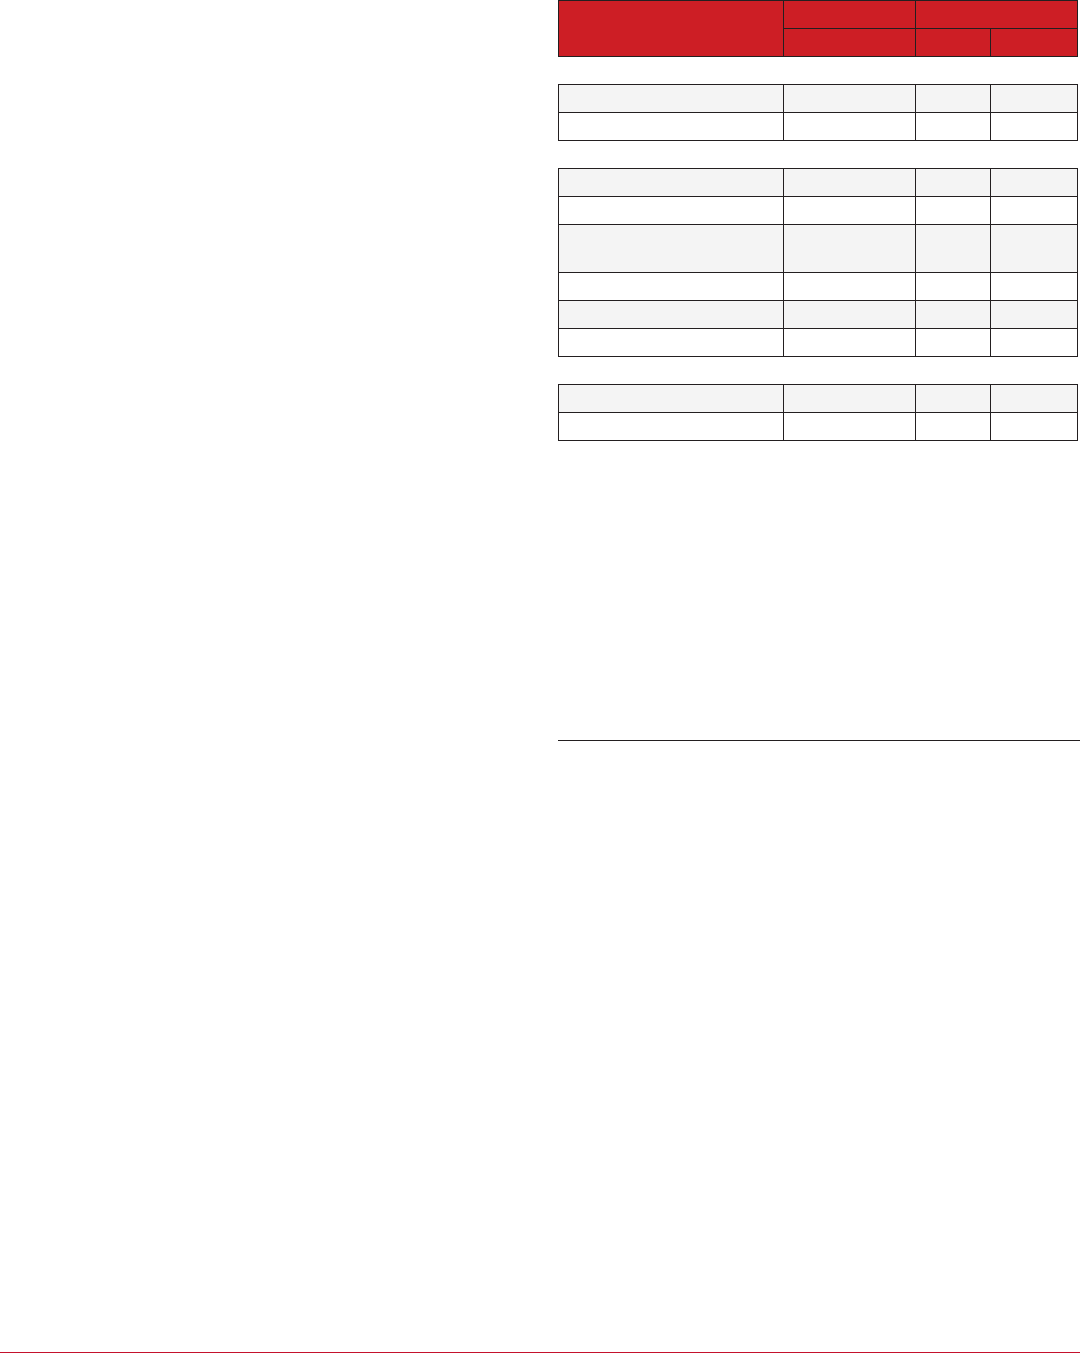
Table 2: Utah Direct Selling Industry State and Local Fiscal
Impacts, 2020
(Millions of Dollars)
Category State Local Total
Tax revenues $127.1 $64.3 $191.4
Government operating expenditures $38.1 $8.5 $46.6
Net state and local revenue $89.0 $55.8 $144.7
Note: Totals may not match exactly due to rounding. These impacts include total revenues
and operating expenditures from Tables 2 and 3.
Source: Kem C. Gardner Policy Institute scal impact modelling
Table 3: Direct Selling State Fiscal Impacts in Utah, 2020
(Millions of Dollars)
Impact Amount
Sales tax revenues $57.2
Personal income tax revenues $58.8
Corporate income tax revenues $11.1
Total State Revenues $127.1
Non-Education expenditures $13.4
Public education expenditures $13.7
Higher education expenditures $11.0
Total state operating expenditures $38.1
Net state revenue $89.0
Note: Totals may not match exactly due to rounding.
Source: Kem C. Gardner Policy Institute scal impact modeling

August 2022
I
gardner.utah.edu INFORMED DECISIONS
TM
4
Government expenditures fund services for the population
of adults and children who live in Utah because of work
opportunities that direct selling companies generate. Public
and higher education expenditures reached a combined total
of $24.7 million, which was nearly two-thirds of total state
operating expenditures related to the direct selling industry
in 2020. Non-education expenditures, on the other hand,
amounted to $13.4 million.
As for local governments, the net scal impact of Utah’s
direct selling industry was $55.8 million in 2020 (see Table
4). This included an estimated $64.3 million in tax revenues
and $8.5 million in operating expenditures for counties
and school districts. Most local tax revenues came from
property taxes, which amounted to $53.9 million. The local
portion of sales tax collections was $10.3 million. As for local
government expenditures, public K–12 education spending
were an estimated $5.1 million, and other county expenditures
amounted to $3.4 million.
Table 4: Direct Selling Local Fiscal Impacts in Utah, 2020
(Millions of Dollars)
Impact Amount
Property tax revenues $53.9
Sales tax revenues $10.3
Total local revenues $64.3
Non-Education expenditures $3.4
Public education expenditures $5.1
Total local operating expenditures $8.5
Net local revenue $55.8
Note: Totals may not match exactly due to rounding. Local revenues and operating
expenditures include counties and school districts. Cities and towns are not included.
Source: Kem C. Gardner Policy Institute scal impact modeling
gardner.utah.edu
I
August 2022
INFORMED DECISIONS
TM
5
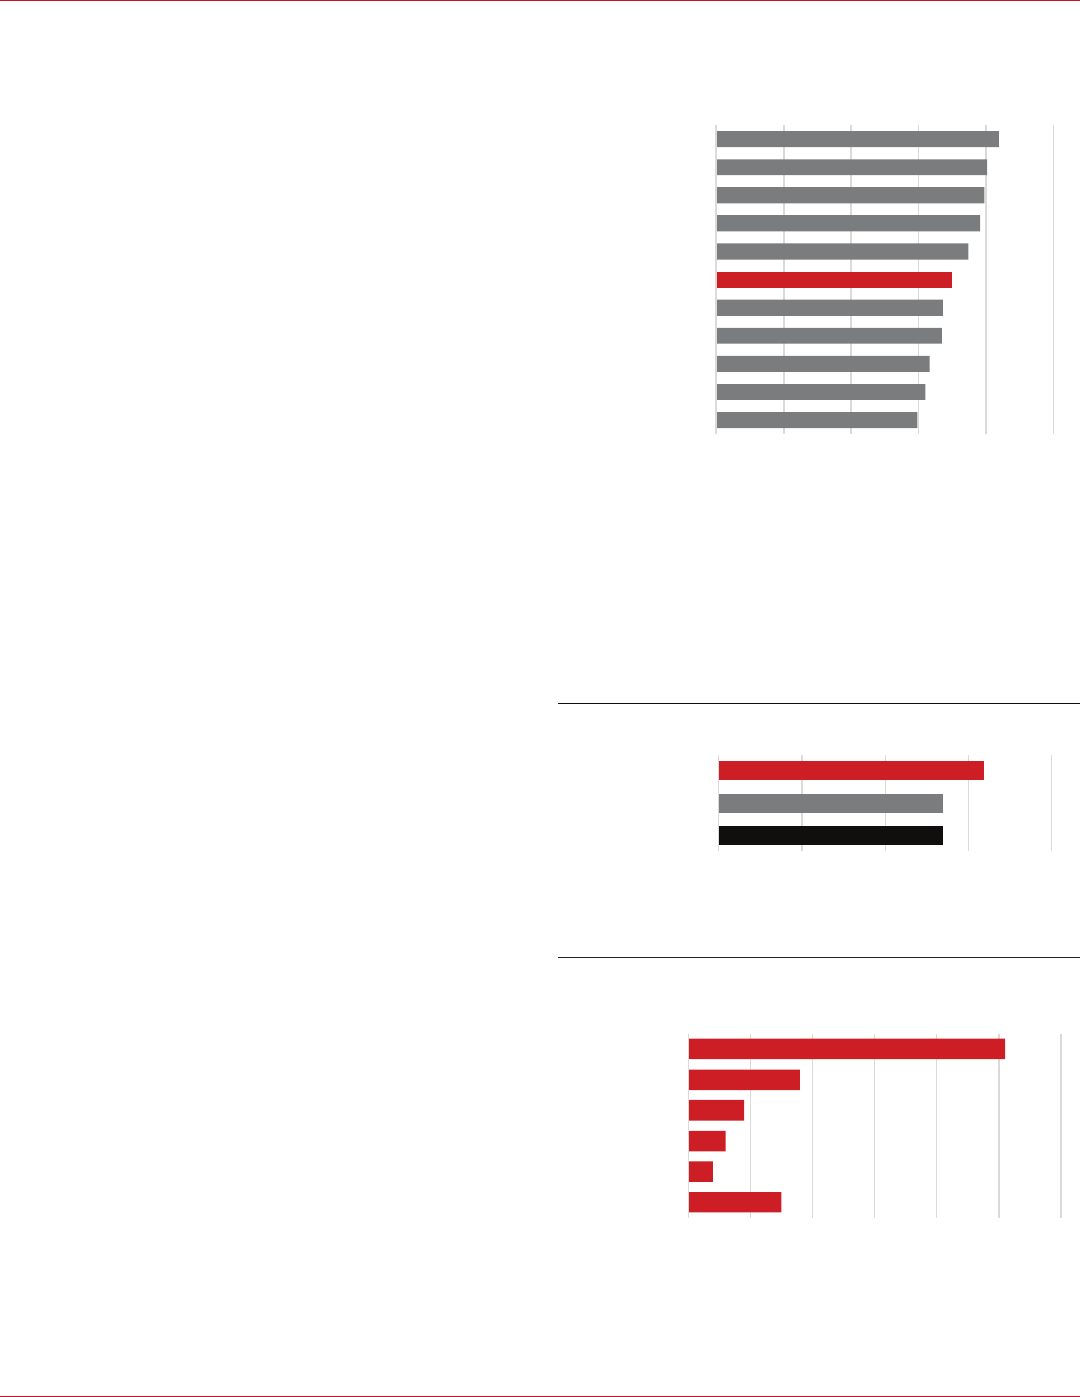
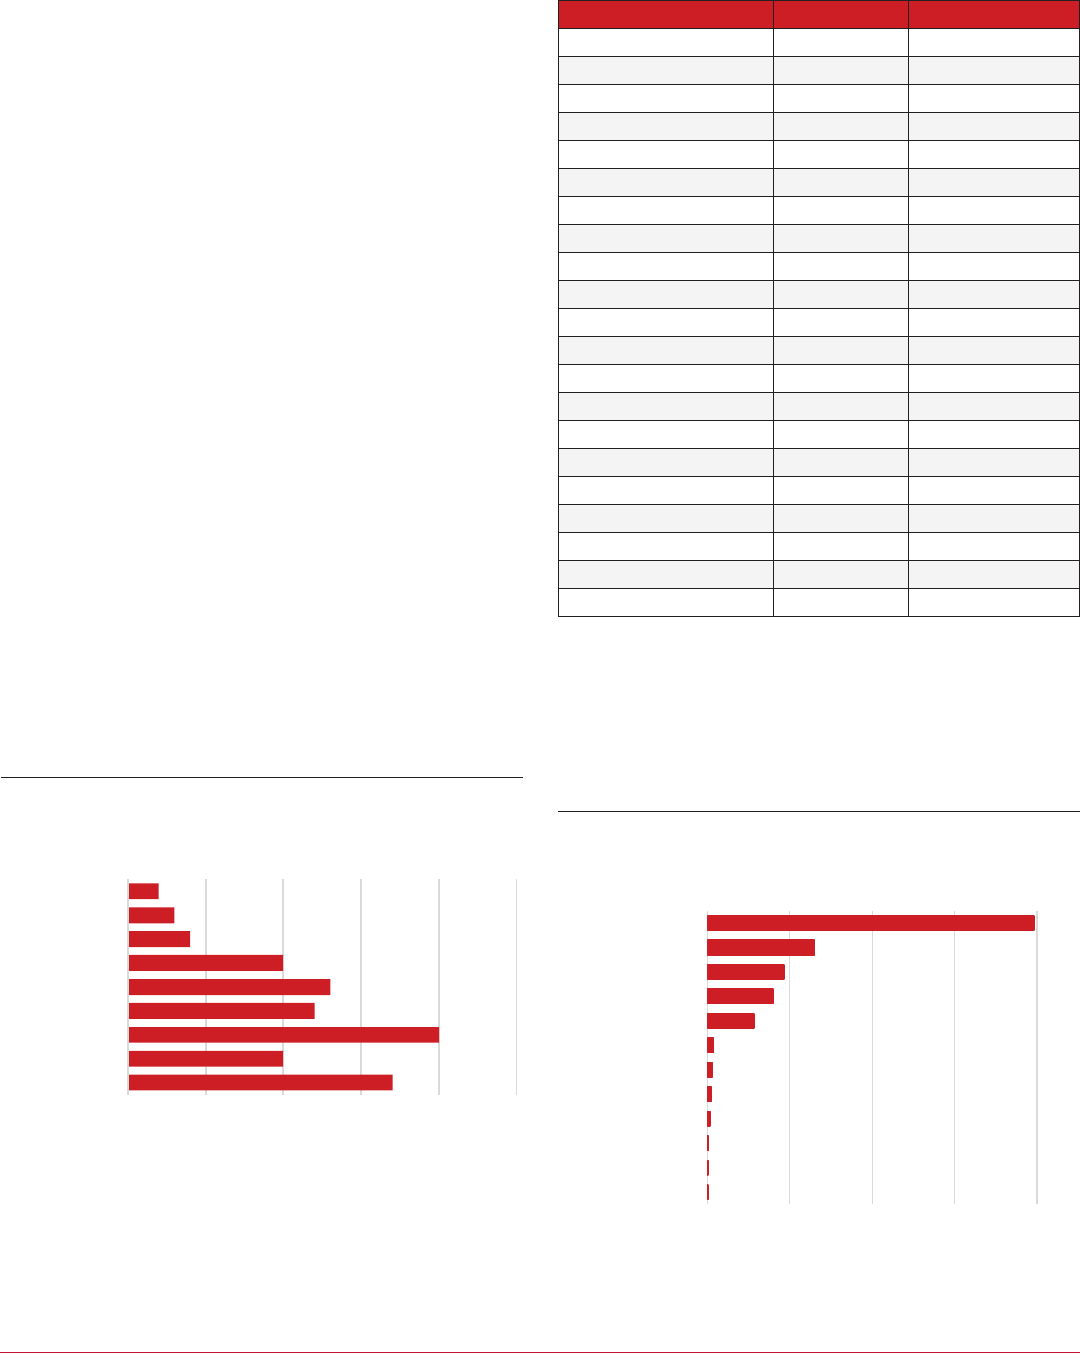
The direct selling industry provided 17,487 Utah jobs in
2020, with an average wage ($63,652) above the state’s average
(53,891). In 2020, direct selling companies staed 11,678 jobs
at large and small businesses.
8
Suppliers to these companies
include manufacturers and service providers in and beyond the
industry’s center in Utah County and Salt Lake County. Selected
suppliers provided 5,312 additional jobs. Besides employment
at direct selling companies and selected suppliers, visitor
spending from direct selling conventions accounts for nearly
497 jobs in the industry. Utah industries with employment
levels similar to the direct selling industry include agriculture,
accommodation, military and publishing (see Figure 3). Section
6 describes the direct selling industry denition and identies
the companies included.
In 2020, 91 direct selling companies and 66 suppliers directly
provided 16,990 Utah jobs and paid employees $1,081.5 million
annually.
9
The average wage per job was $63,652 industry-
wide, which was 18.4% above the statewide average of $53,782
for all other industries (see Figure 4). Compensation at Utah
direct selling companies and suppliers also included employer
benets estimated at $13,766 per job, on average. Wages and
benets add to $77,418 per job and total compensation of
$1,315.3 million for all employees in the industry. These wage
data do not reect employment for direct selling conventions.
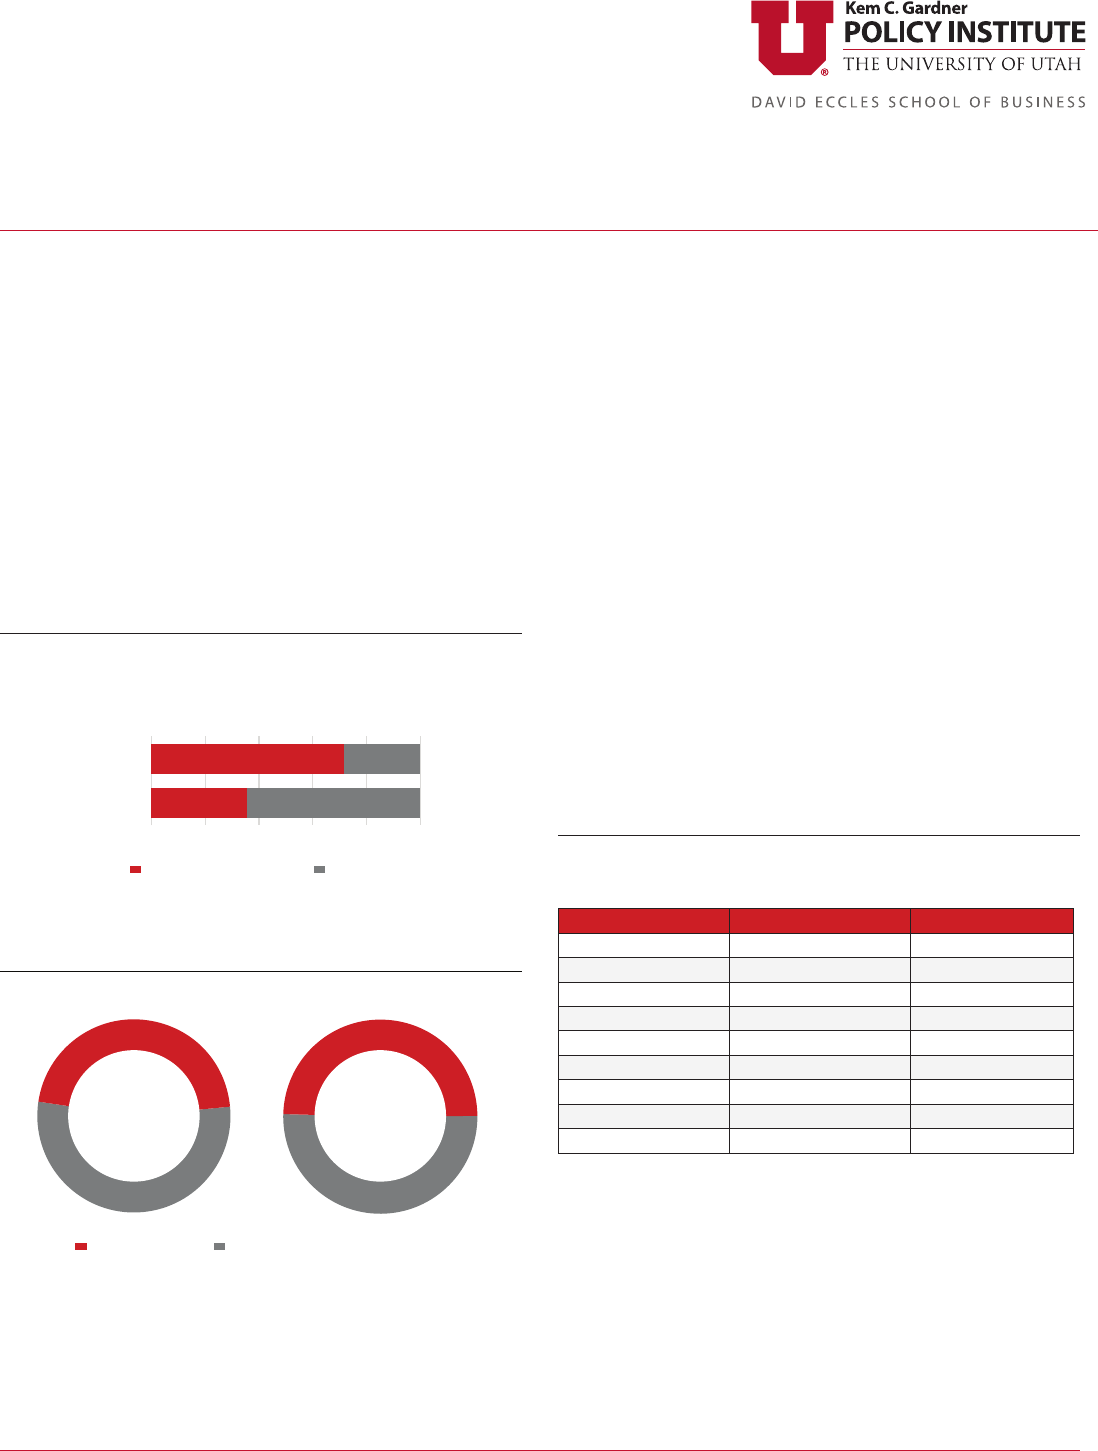
Direct Selling Company Segmentation by Product
and Employment
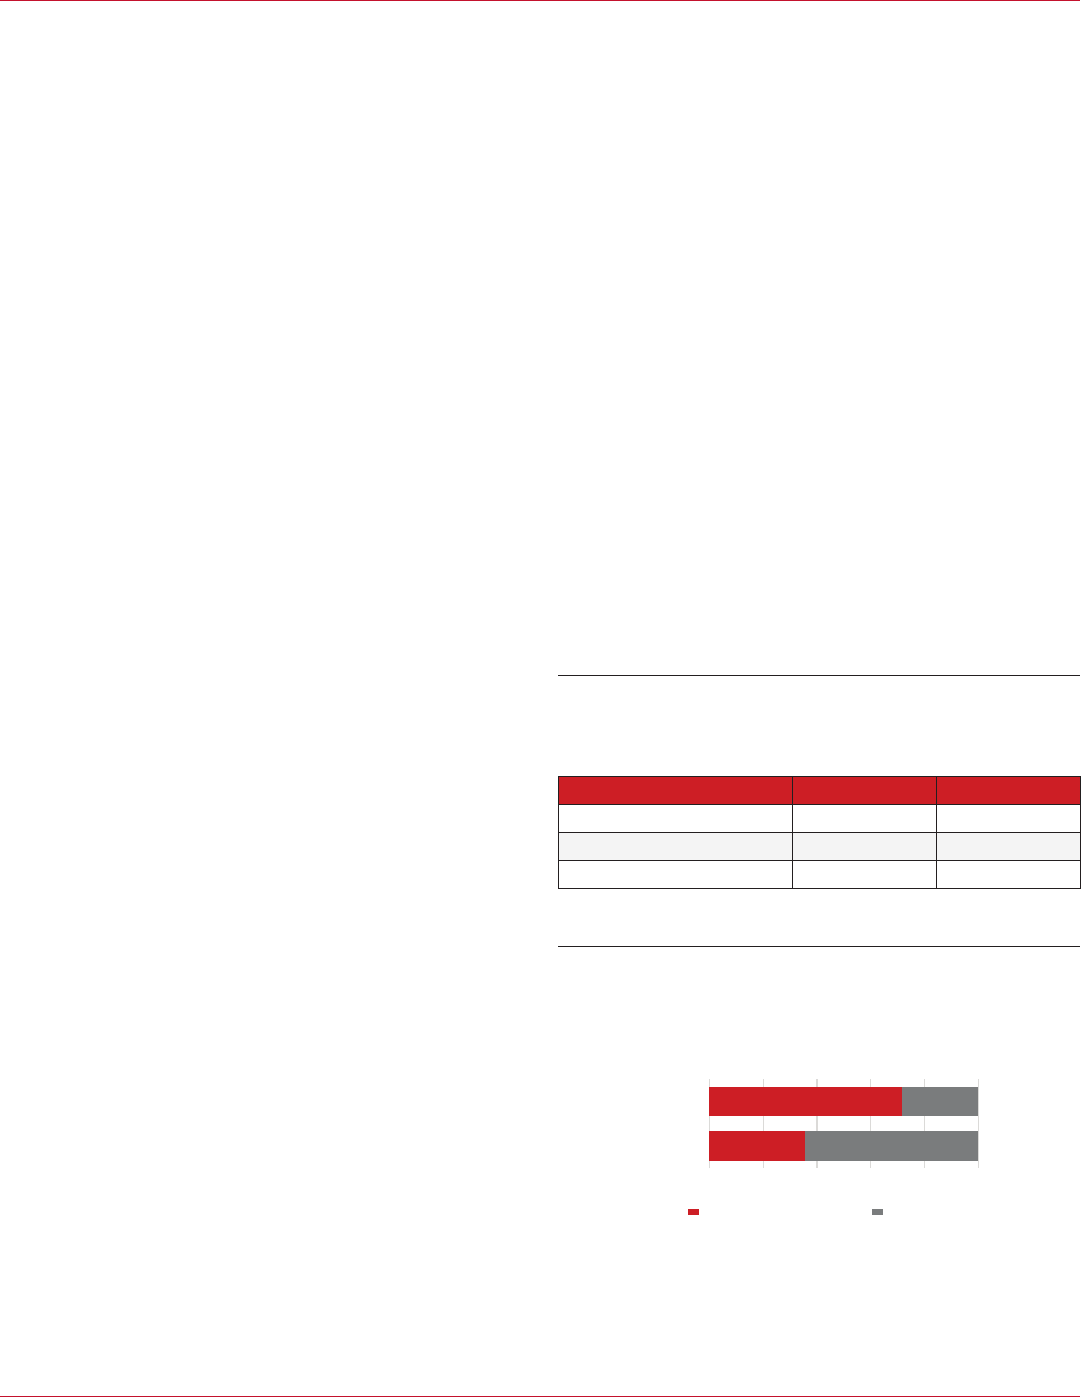
Among the goods and services that Utah direct selling
companies provide, the “health and wellness” segment is the
most dominant. In the ve-category classication system
shown in Figure 5, 56% of Utah direct selling companies have
health and wellness oerings, which include things such as
vitamins, nutritional supplements and weight-loss products.
The second-largest segment, “beauty and fashion,” represents
20% of companies and includes skin care, hair care and apparel
products. The share of companies providing “services” or
“essential oils” are 10% and 7%, respectively. Services include
nancial services, pest control and cyber risk management.
“Food and beverage” companies and other tangible product
sellers round out the industry. “Other products” includes solar
panels and windows, home organization and décor items,
technology devices, cleaning products, craft supplies, and
stationery. Of the 91 total companies, nine participate in two or
more segments.
In 2020, 91 direct selling companies provided 11,678 Utah
jobs and paid their employees a cumulative $802.6 million
annually. At direct selling companies (not including suppliers
in the industry), the average wage per job was $68,727, which
Section 2: Industry Employment and Wages
Figure 3: Direct Selling and Industries With Similar
Employment, 2020
(Utah Jobs)
Note: Includes industries within 3,500 jobs of direct selling, ranking from 36th to 46th by
employment among 92 disaggregated industries. Agriculture includes crop and animal
activity, but not support activities for agriculture. Arts and sports include performing arts,
spectator sports, and related industries. The publishing industry includes print formats
and software, but not internet publishing. Metal product manufacturing involves
fabricated products, not primary metals. The building and garden industry includes
building material and garden equipment and supplies. Miscellaneous retail includes
brick-and-mortar orists; oce supplies, stationery and gift stores; used merchandise; pet
supplies; art dealers; and manufactured home dealers.
Source: U.S. Bureau of Economic Analysis, Interactive Data Table SAEMP25N Total
Full-Time and Part-Time Employment by NAICS Industry
17 (19%)
10 (11%)
20 (22%)
12 (13%)
13 (14%)
10 (11%)
4 (4%)
3 (3%)
2 (2%)
0 5 10 15 20 25
Less than 5
5 to 9
10 to 19
20 to 49
50 to 99
100 to 249
250 to 499
500 to 1,499
1,500 and above
Companies
Jobs
14,925
15,497
15,828
16,707
16,784
17,487
18,697
19,543
19,891
20,077
20,925
0 5,000 10,000 15,000 20,000 25,000
Misc. Store Retail
Bldg. & Garden Retail
Metal Product Mfg.
Publishing
Federal Military
Direct Selling
Amusement & Rec.
Food Manufacturing
Accommodation
Arts & Sports
Agriculture
$53,891
$53,782
$63,652
$0 $20,000 $40,000 $60,000 $80,000
All Industries
Other Industries
Direct Selling Industry
177
490
1,063
1,258
1,563
1,842
2,023
2,219
2,359
2,434
2,571
2,994
3,418
4,715
9,112
0 2,000 4,000 6,000 8,000 10,000
Natural resources
Information services
Other services
Finance & insurance
Government
Real estate
Professional services
Leisure & hospitality
Wholesale trade
Health & education
Transport. & utilities
Business services
Construction
Manufacturing
Retail trade
2
2
20
51
69
88
104
843
1,200
1,400
1,946
5,953
0 1,500 3,000 4,500 6,000
Real estate
Other services
Finance & insurance
Professional services
Construction
Health & education
Information services
Business services
Transport. & utilities
Wholesale trade
Manufacturing
Retail trade
$540.7
(67.4%)
8,614
(73.8%)
$223.7
(27.9%)
2,357
(20.2%)
$38.2
(4.8%)
707
(6.1%)
0% 20% 40% 60% 80% 100%
Wages
($ Millions)
Employment
(Jobs)
Utah Salt Lake Other Counties
$155.1
(55.6%)
3,497
(65.8%)
36
(54.5%)
$86.2
(30.9%)
1,136
(21.4%)
21
(31.8%)
$37.6
(13.5%)
679
(12.8%)
9
(13.6%)
0% 10% 20% 30% 40% 50% 60% 70% 80% 90% 100%
Wages
($ Millions)
Employment
(Jobs)
Number of
Companies
Manufacturing Services Ingredients
66
(100.0%)
5,312
(100.0%)
$278.9
(100.0%)
4,336
(6.9%)
21,682
(6.9%)
40,695
(64.4%)
203,473
(64.4%)
18,192
(28.8%)
90,961
(28.8%)
0.0% 20.0% 40.0% 60.0% 80.0% 100.0%
Average
Annual
Five-Year
Total
Utah Other States (U.S.) International
316,116
(100.0%)
63,223
(100.0%)
Figure 4: Average Annual Wages per Employee, 2020
Note: Employee wages do not include benets or income from self-employment.
Source: Utah Department of Workforce Services, information request
17 (19%)
10 (11%)
20 (22%)
12 (13%)
13 (14%)
10 (11%)
4 (4%)
3 (3%)
2 (2%)
0 5 10 15 20 25
Less than 5
5 to 9
10 to 19
20 to 49
50 to 99
100 to 249
250 to 499
500 to 1,499
1,500 and above
Companies
Jobs
14,925
15,497
15,828
16,707
16,784
17,487
18,697
19,543
19,891
20,077
20,925
0 5,000 10,000 15,000 20,000 25,000
Misc. Store Retail
Bldg. & Garden Retail
Metal Product Mfg.
Publishing
Federal Military
Direct Selling
Amusement & Rec.
Food Manufacturing
Accommodation
Arts & Sports
Agriculture
$53,891
$53,782
$63,652
$0 $20,000 $40,000 $60,000 $80,000
All Industries
Other Industries
Direct Selling Industry
177
490
1,063
1,258
1,563
1,842
2,023
2,219
2,359
2,434
2,571
2,994
3,418
4,715
9,112
0 2,000 4,000 6,000 8,000 10,000
Natural resources
Information services
Other services
Finance & insurance
Government
Real estate
Professional services
Leisure & hospitality
Wholesale trade
Health & education
Transport. & utilities
Business services
Construction
Manufacturing
Retail trade
2
2
20
51
69
88
104
843
1,200
1,400
1,946
5,953
0 1,500 3,000 4,500 6,000
Real estate
Other services
Finance & insurance
Professional services
Construction
Health & education
Information services
Business services
Transport. & utilities
Wholesale trade
Manufacturing
Retail trade
$540.7
(67.4%)
8,614
(73.8%)
$223.7
(27.9%)
2,357
(20.2%)
$38.2
(4.8%)
707
(6.1%)
0% 20% 40% 60% 80% 100%
Wages
($ Millions)
Employment
(Jobs)
Utah Salt Lake Other Counties
$155.1
(55.6%)
3,497
(65.8%)
36
(54.5%)
$86.2
(30.9%)
1,136
(21.4%)
21
(31.8%)
$37.6
(13.5%)
679
(12.8%)
9
(13.6%)
0% 10% 20% 30% 40% 50% 60% 70% 80% 90% 100%
Wages
($ Millions)
Employment
(Jobs)
Number of
Companies
Manufacturing Services Ingredients
66
(100.0%)
5,312
(100.0%)
$278.9
(100.0%)
4,336
(6.9%)
21,682
(6.9%)
40,695
(64.4%)
203,473
(64.4%)
18,192
(28.8%)
90,961
(28.8%)
0.0% 20.0% 40.0% 60.0% 80.0% 100.0%
Average
Annual
Five-Year
Total
Utah Other States (U.S.) International
316,116
(100.0%)
63,223
(100.0%)
Figure 5: Utah Direct Selling Companies by Segment, 2020
(Number of Companies; Share of 91 Companies)
Note: Other products include home improvement, household, craft, and other tangible
goods. Shares add to more than 100% because nine of these companies belong in two or
more categories.
Source: Kem C. Gardner Policy Institute analysis of data from Dorsey & Whitney LLP
$53,782
$63,652
$0 $20,000 $40,000 $60,000 $80,000
Other Industries
Direct Selling Industry
71.7% 28.3%
35.6% 64.4%
0% 20% 40% 60% 80% 100%
Total Utah
Commodity Exports
Utah Non-Gold
Commodity Exports
Direct Selling Industry Other Industries
Direct impacts
(Direct selling)
Indirect and induced impacts
(Beyond the direct selling industry)
100.0%
($8.8 Billion)
100.0%
($17.7 Billion)
17,487
20,751
$1.329.9
$1,347.4
38,238 jobs
1.8% of Utah
employment
$2,677.3 million
2.2% of Utah
earnings
15 (16%)
4 (4%)
6 (7%)
9 (10%)
18 (20%)
51 (56%)
0 10 20 30 40 50 60
Other Products
Food & Beverages
Essential Oils
Services
Beauty & Fashion
Health & Wellness
15,497
15,828
16,707
16,784
17,487
18,697
19,543
19,891
0 5,000 10,000 15,000 20,000 25,000
Bldg. & Garden Retail
Metal Product Mfg.
Publishing
Federal Military
Direct Selling
Amusement & Rec.
Food Manufacturing
Accommodation
$0.0
$20.0
$40.0
$60.0
$80.0
$100.0
$120.0
$140.0
$160.0
$180.0
$200.0
State Local
$127.1
$64.3
Tax Revenues
Revenues
$191.4
$38.1
$8.5
Government
Operating Expenditures
$46.6
$89.0
$55.8
Net State and
Local Revenue
$144.7
225,155 (71.2%) 90,961(28.8%)
0 100,000 200,000 300,000
Domestic (U.S.) International
316,116
(100.0%)
August 2022
I
gardner.utah.edu INFORMED DECISIONS
TM
6
was 27.8% above the statewide average of $53,778 for all other
companies. Compensation at Utah direct selling companies
also included employer benets estimated at $13,766 per
job, on average. Wages and benets added to $77,418 per job
and total compensation of $963.2 million for all direct selling
company employees.
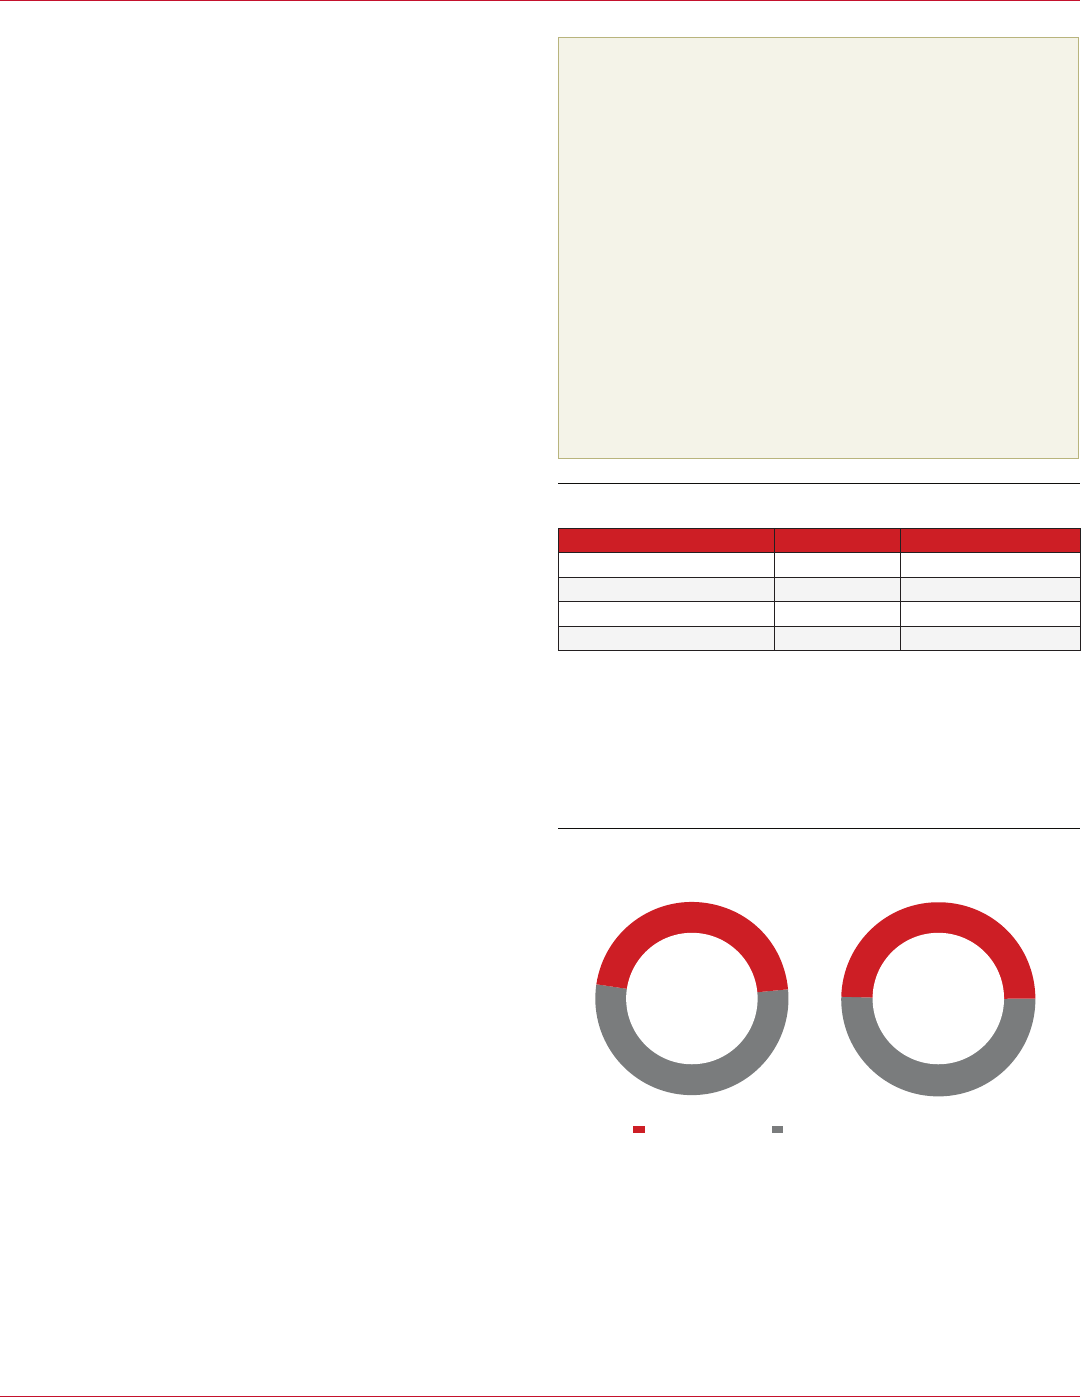
Utah’s direct selling companies vary signicantly in size (see
Figure 6). In 2020, nearly one-fth (17 of 91 companies) were
small businesses with fewer than ve employees, and 79% of the
industry (72 companies) had fewer than 100 employees. The ve
largest direct sellers in Utah each provided at least 500 jobs.
Principal Utah employers in the direct selling industry include
21 direct selling companies with at least 100 employees (see Table
5). The companies were founded between 1972 and 2017. In
2020, nine of them provided 100 to 249 in-state jobs. The largest
two employers, doTERRA and Young Living, each provided more
than 1,500 jobs, and the three companies rounding out the top
ve were Nu Skin, USANA Health Sciences, and Nature’s Sunshine.
Note that the Utah Department of Workforce Services does not
release exact employment for individual companies.
Most of Utah’s direct selling companies identify as retail or
wholesale trade companies (see Figure 7). In 2020, half of the
industry’s employment, 5,953 jobs, was in the retail trade sector—
commonly classied as nonstore retailers, although a portion was
in e-commerce or miscellaneous retail sales.
10
On the other hand,
over one-tenth of industry employment came from companies in
wholesale trade––primarily classied as pharmaceutical, which
includes vitamins, other nutraceuticals and certain cosmetic
products. Besides retail and wholesale trade, most of the
remaining employment at direct selling companies was either
Figure 6: Utah Direct Selling Companies by Size, 2020
(Companies Grouped by Number of Jobs)
Note: Employment at direct selling companies does not include independent sales
representatives (direct sellers). The category “20 to 49” includes Activz, which has 21 to 53
employees. Additionally, seven larger companies may belong in either of two
employment ranges: Nature’s Sunshine, Aptive Environmental, Blue Raven Solar, NewAge,
4Life Research USA , Stampin' Up, and Younique (see Table 5 for their employment).
Source: Utah Department of Workforce Services, FIrmFind
17 (19%)
10 (11%)
20 (22%)
12 (13%)
13 (14%)
10 (11%)
4 (4%)
3 (3%)
2 (2%)
0 5 10 15 20
25
Less than 5
5 to 9
10 to 19
20 to 49
50 to 99
100 to 249
250 to 499
500 to 1,499
1,500 and above
Companies
Jobs
14,925
15,497
15,828
16,707
16,784
17,487
18,697
19,543
19,891
20,077
20,925
0 5,000 10,000 15,000 20,000 25,000
Misc. Store Retail
Bldg. & Garden Retail
Metal Product Mfg.
Publishing
Federal Military
Direct Selling
Amusement & Rec.
Food Manufacturing
Accommodation
Arts & Sports
Agriculture
$53,891
$53,782
$63,652
$0 $20,000 $40,000 $60,000 $80,000
All Industries
Other Industries
Direct Selling Industry
177
490
1,063
1,258
1,563
1,842
2,023
2,219
2,359
2,434
2,571
2,994
3,418
4,715
9,112
0 2,000 4,000 6,000 8,000 10,000
Natural resources
Information services
Other services
Finance & insurance
Government
Real estate
Professional services
Leisure & hospitality
Wholesale trade
Health & education
Transport. & utilities
Business services
Construction
Manufacturing
Retail trade
2
2
20
51
69
88
104
843
1,200
1,400
1,946
5,953
0 1,500 3,000 4,500 6,000
Real estate
Other services
Finance & insurance
Professional services
Construction
Health & education
Information services
Business services
Transport. & utilities
Wholesale trade
Manufacturing
Retail trade
$540.7
(67.4%)
8,614
(73.8%)
$223.7
(27.9%)
2,357
(20.2%)
$38.2
(4.8%)
707
(6.1%)
0% 20% 40% 60% 80% 100%
Wages
($ Millions)
Employment
(Jobs)
Utah Salt Lake Other Counties
$155.1
(55.6%)
3,497
(65.8%)
36
(54.5%)
$86.2
(30.9%)
1,136
(21.4%)
21
(31.8%)
$37.6
(13.5%)
679
(12.8%)
9
(13.6%)
0% 10% 20% 30% 40% 50% 60% 70% 80% 90% 100%
Wages
($ Millions)
Employment
(Jobs)
Number of
Companies
Manufacturing Services Ingredients
66
(100.0%)
5,312
(100.0%)
$278.9
(100.0%)
4,336
(6.9%)
21,682
(6.9%)
40,695
(64.4%)
203,473
(64.4%)
18,192
(28.8%)
90,961
(28.8%)
0.0% 20.0% 40.0% 60.0% 80.0% 100.0%
Average
Annual
Five-Year
Total
Utah Other States (U.S.) International
316,116
(100.0%)
63,223
(100.0%)
Table 5: Utah’s Largest Employers Among Direct Selling
Companies, 2020
(Companies with at Least 100 Employees)
Company Jobs
1
Year Established
2
doTERRA 2,265 to 3,526 2008
Young Living 1,505 to 3,007 1993
Nu Skin 606 to 1,260 1984
USANA Health Sciences 520 to 1,048 1992
Nature’s Sunshine 370 to 797 1972
Stampin' Up 300 to 598 1988
Younique 300 to 598 2012
Aptive Environmental 270 to 548 2015
Paparazzi Accessories 250 to 499 2011
4Life Research USA 205 to 405 1998
Blue Raven Solar 170 to 397 2014
NewAge
3
161 to 371 2016
ASEA Global 100 to 249 2010
LifeVantage 100 to 249 2003
Modere 100 to 249 1987
Plunder Design 100 to 249 2014
SupraNaturals 100 to 249 2004
Thrive Life 100 to 249 2005
Unicity International 100 to 249 2005
Xyngular 100 to 249 2009
Zyia Active 100 to 249 2017
Note:
1. Disclosure limitations prevent the reporting of exact employment counts by company.
In addition, Utah employment at direct selling companies does not include
independent sales representatives (direct sellers).
2. Companies have reorganized and renamed themselves over the years. Some had
signicant precursors before the founding year given.
3. In July 2020, NewAge acquired ARIIX, which accounts for 50 to 99 of the jobs at
NewAge.
Source: Utah Department of Workforce Services and company websites
17 (19%)
10 (11%)
20 (22%)
12 (13%)
13 (14%)
10 (11%)
4 (4%)
3 (3%)
2 (2%)
0 5 10 15 20 25
Less than 5
5 to 9
10 to 19
20 to 49
50 to 99
100 to 249
250 to 499
500 to 1,499
1,500 and above
Companies
Jobs
14,925
15,497
15,828
16,707
16,784
17,487
18,697
19,543
19,891
20,077
20,925
0 5,000 10,000 15,000 20,000 25,000
Misc. Store Retail
Bldg. & Garden Retail
Metal Product Mfg.
Publishing
Federal Military
Direct Selling
Amusement & Rec.
Food Manufacturing
Accommodation
Arts & Sports
Agriculture
$53,891
$53,782
$63,652
$0 $20,000 $40,000 $60,000 $80,000
All Industries
Other Industries
Direct Selling Industry
177
490
1,063
1,258
1,563
1,842
2,023
2,219
2,359
2,434
2,571
2,994
3,418
4,715
9,112
0 2,000 4,000 6,000 8,000 10,000
Natural resources
Information services
Other services
Finance & insurance
Government
Real estate
Professional services
Leisure & hospitality
Wholesale trade
Health & education
Transport. & utilities
Business services
Construction
Manufacturing
Retail trade
2
2
20
51
69
88
104
843
1,200
1,400
1,946
5,953
0 1,500 3,000 4,500 6,000
Real estate
Other services
Finance & insurance
Professional services
Construction
Health & education
Information services
Business services
Transport. & utilities
Wholesale trade
Manufacturing
Retail trade
$540.7
(67.4%)
8,614
(73.8%)
$223.7
(27.9%)
2,357
(20.2%)
$38.2
(4.8%)
707
(6.1%)
0% 20% 40% 60% 80% 100%
Wages
($ Millions)
Employment
(Jobs)
Utah Salt Lake Other Counties
$155.1
(55.6%)
3,497
(65.8%)
36
(54.5%)
$86.2
(30.9%)
1,136
(21.4%)
21
(31.8%)
$37.6
(13.5%)
679
(12.8%)
9
(13.6%)
0% 10% 20% 30% 40% 50% 60% 70% 80% 90% 100%
Wages
($ Millions)
Employment
(Jobs)
Number of
Companies
Manufacturing Services Ingredients
66
(100.0%)
5,312
(100.0%)
$278.9
(100.0%)
4,336
(6.9%)
21,682
(6.9%)
40,695
(64.4%)
203,473
(64.4%)
18,192
(28.8%)
90,961
(28.8%)
0.0% 20.0% 40.0% 60.0% 80.0% 100.0%
Average
Annual
Five-Year
Total
Utah Other States (U.S.) International
316,116
(100.0%)
63,223
(100.0%)
Figure 7: Utah Direct Selling Company Employment by
Sector, 2020
(Jobs)
Note: Employment does not include suppliers to direct selling companies or industry
conventions. Sectors follow the North American Industry Classication System (NAICS).
Other industries include natural resources, real estate and other services.
Source: Utah Department of Workforce Services, information request

gardner.utah.edu
I
August 2022
INFORMED DECISIONS
TM
7
in manufacturing (1,946 jobs primarily under pharmaceutical
manufacturing), transportation and utilities (1,200 jobs primarily
under warehousing and storage), or business services (843 jobs
primarily under pest control or telemarketing).
Direct selling companies are located in ve counties, with
a noticeable concentration in Utah County. Several of these
91 companies may have multiple establishments, which
are commonly located at dierent addresses from their
respective company headquarters. Of 114 in-state direct selling
establishments operating in 2020, 55% were in Utah County,
34% were in Salt Lake County, and the remaining 11% were in
Washington, Davis, Kane, Weber and Duchesne counties.
Based on average employment, Utah County’s 63 direct selling
establishments were larger than those in other counties. While
direct selling headquarters and other establishments coalesce
in the Wasatch Front, their Utah suppliers and the companies
sustained by the industry’s economic impacts are more widely
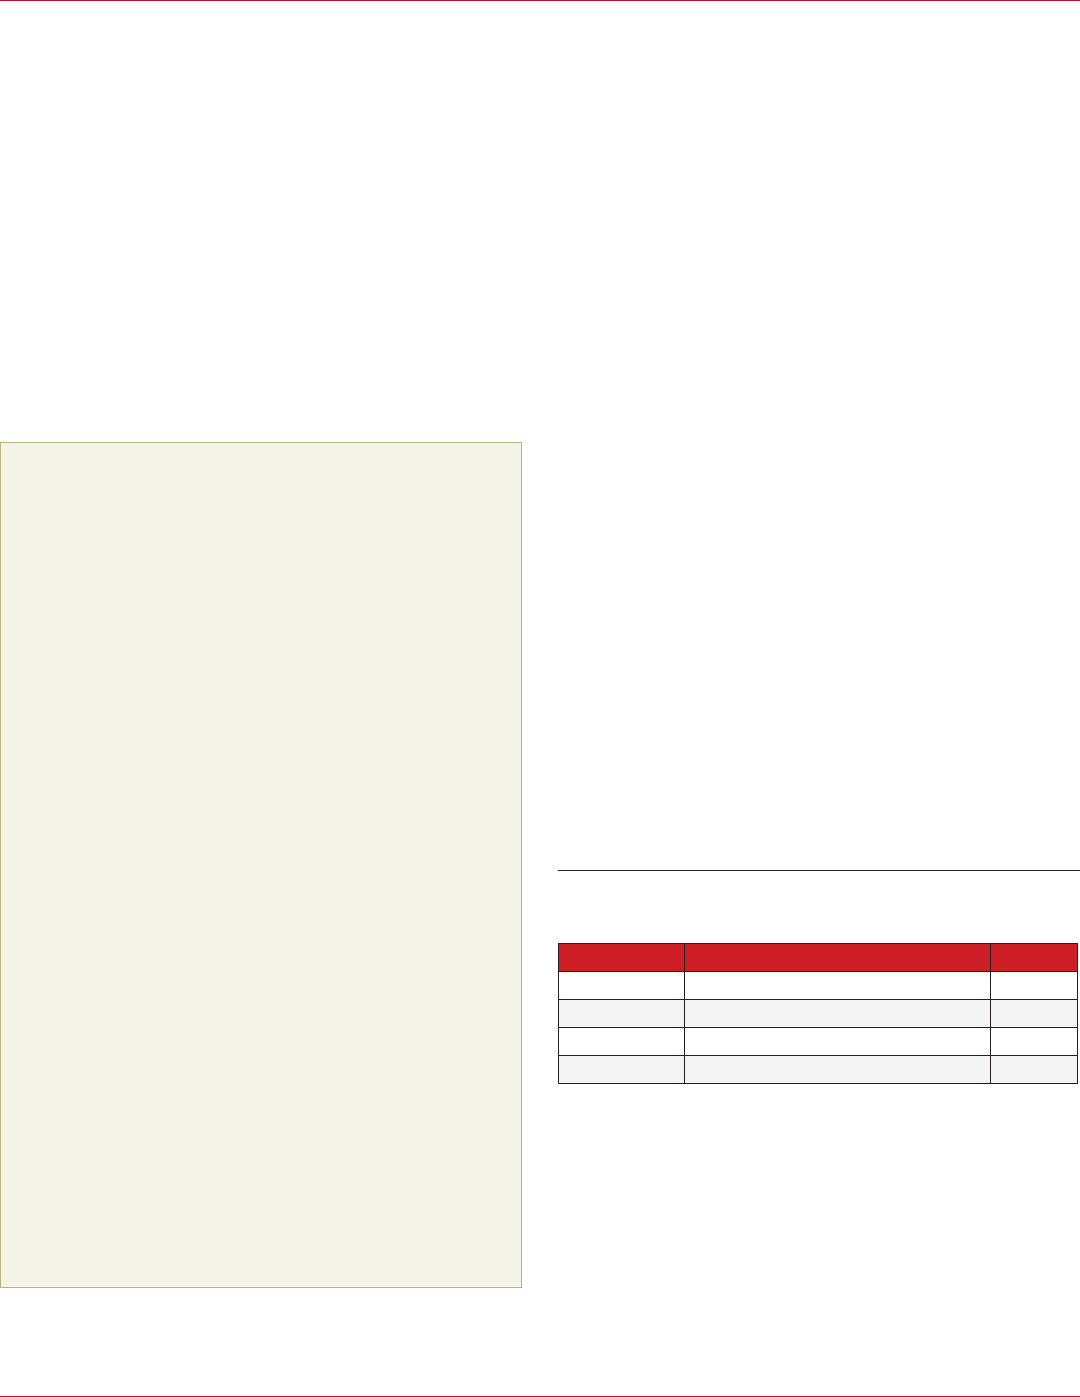
distributed across the state. Over 8,600 direct selling jobs were
in Utah County, nearly three-fourths (73.8%) of the industry’s
statewide total (see Figure 8). Salt Lake County was home to
more than 2,350 direct selling jobs, and the remaining 707 jobs
were in Washington, Davis, Kane, Weber and Duchesne counties.
More than two-thirds of the statewide employee wages from
direct selling companies, or $540.7 million, went to people
working in Utah County. Salt Lake County followed with
17 (19%)
10 (11%)
20 (22%)
12 (13%)
13 (14%)
10 (11%)
4 (4%)
3 (3%)
2 (2%)
0 5 10 15 20 25
Less than 5
5 to 9
10 to 19
20 to 49
50 to 99
100 to 249
250 to 499
500 to 1,499
1,500 and above
Companies
Jobs
14,925
15,497
15,828
16,707
16,784
17,487
18,697
19,543
19,891
20,077
20,925
0 5,000 10,000 15,000 20,000 25,000
Misc. Store Retail
Bldg. & Garden Retail
Metal Product Mfg.
Publishing
Federal Military
Direct Selling
Amusement & Rec.
Food Manufacturing
Accommodation
Arts & Sports
Agriculture
$53,891
$53,782
$63,652
$0 $20,000 $40,000 $60,000 $80,000
All Industries
Other Industries
Direct Selling Industry
177
490
1,063
1,258
1,563
1,842
2,023
2,219
2,359
2,434
2,571
2,994
3,418
4,715
9,112
0 2,000 4,000 6,000 8,000 10,000
Natural resources
Information services
Other services
Finance & insurance
Government
Real estate
Professional services
Leisure & hospitality
Wholesale trade
Health & education
Transport. & utilities
Business services
Construction
Manufacturing
Retail trade
2
2
20
51
69
88
104
843
1,200
1,400
1,946
5,953
0 1,500 3,000 4,500 6,000
Real estate
Other services
Finance & insurance
Professional services
Construction
Health & education
Information services
Business services
Transport. & utilities
Wholesale trade
Manufacturing
Retail trade
$540.7
(67.4%)
8,614
(73.8%)
$223.7
(27.9%)
2,357
(20.2%)
$38.2
(4.8%)
707
(6.1%)
0% 20% 40% 60% 80% 100%
Wages
($ Millions)
Employment
(Jobs)
Utah Salt Lake Other Counties
$155.1
(55.6%)
3,497
(65.8%)
36
(54.5%)
$86.2
(30.9%)
1,136
(21.4%)
21
(31.8%)
$37.6
(13.5%)
679
(12.8%)
9
(13.6%)
0% 10% 20% 30% 40% 50% 60% 70% 80% 90% 100%
Wages
($ Millions)
Employment
(Jobs)
Number of
Companies
Manufacturing Services Ingredients
66
(100.0%)
5,312
(100.0%)
$278.9
(100.0%)
4,336
(6.9%)
21,682
(6.9%)
40,695
(64.4%)
203,473
(64.4%)
18,192
(28.8%)
90,961
(28.8%)
0.0% 20.0% 40.0% 60.0% 80.0% 100.0%
Average
Annual
Five-Year
Total
Utah Other States (U.S.) International
316,116
(100.0%)
63,223
(100.0%)
Figure 8: Direct Selling Company Employment and Wages
by County, 2020
Note: Other counties include Davis, Washington, Duchesne, Kane, Tooele and Weber, each
with one to four direct selling establishments. Disclosure limitations prevent the reporting
of exact employment counts for these counties. Totals are 11,678 jobs and $802.6 million
in wages.
Source: Utah Department of Workforce Services, FirmFind and information request
wages of $223.7 million from direct selling companies, 27.9%
of the state’s total, which was well above its 20.2% share of
employment and reected relatively well-paying jobs. Finally,
companies in Washington, Davis, Kane, Weber and Duchesne
counties paid a cumulative $38.2 million to direct selling
company employees, 6.1% of the statewide total.
Suppliers Include Utah Manufacturers and Service
Providers in Eight Counties
A large number of Utah workers and companies earn income
by supplying inputs to direct selling companies. The Gardner
Institute analyzed the employment, wages and locations of
66 noteworthy suppliers in eight counties.
11
The rm Dorsey
& Whitney selected these in-state suppliers from Utah’s direct
sales industry by compiling and corroborating responses from
individuals in the industry. The guiding principle for inclusion
was that a company’s primary line of business be supplying
inputs to direct selling companies. This list of suppliers is not
intended to be comprehensive of all Utah suppliers that make
large or small, occasional or frequent sales to Utah’s direct
selling companies.
12
See Section 6 for further details.
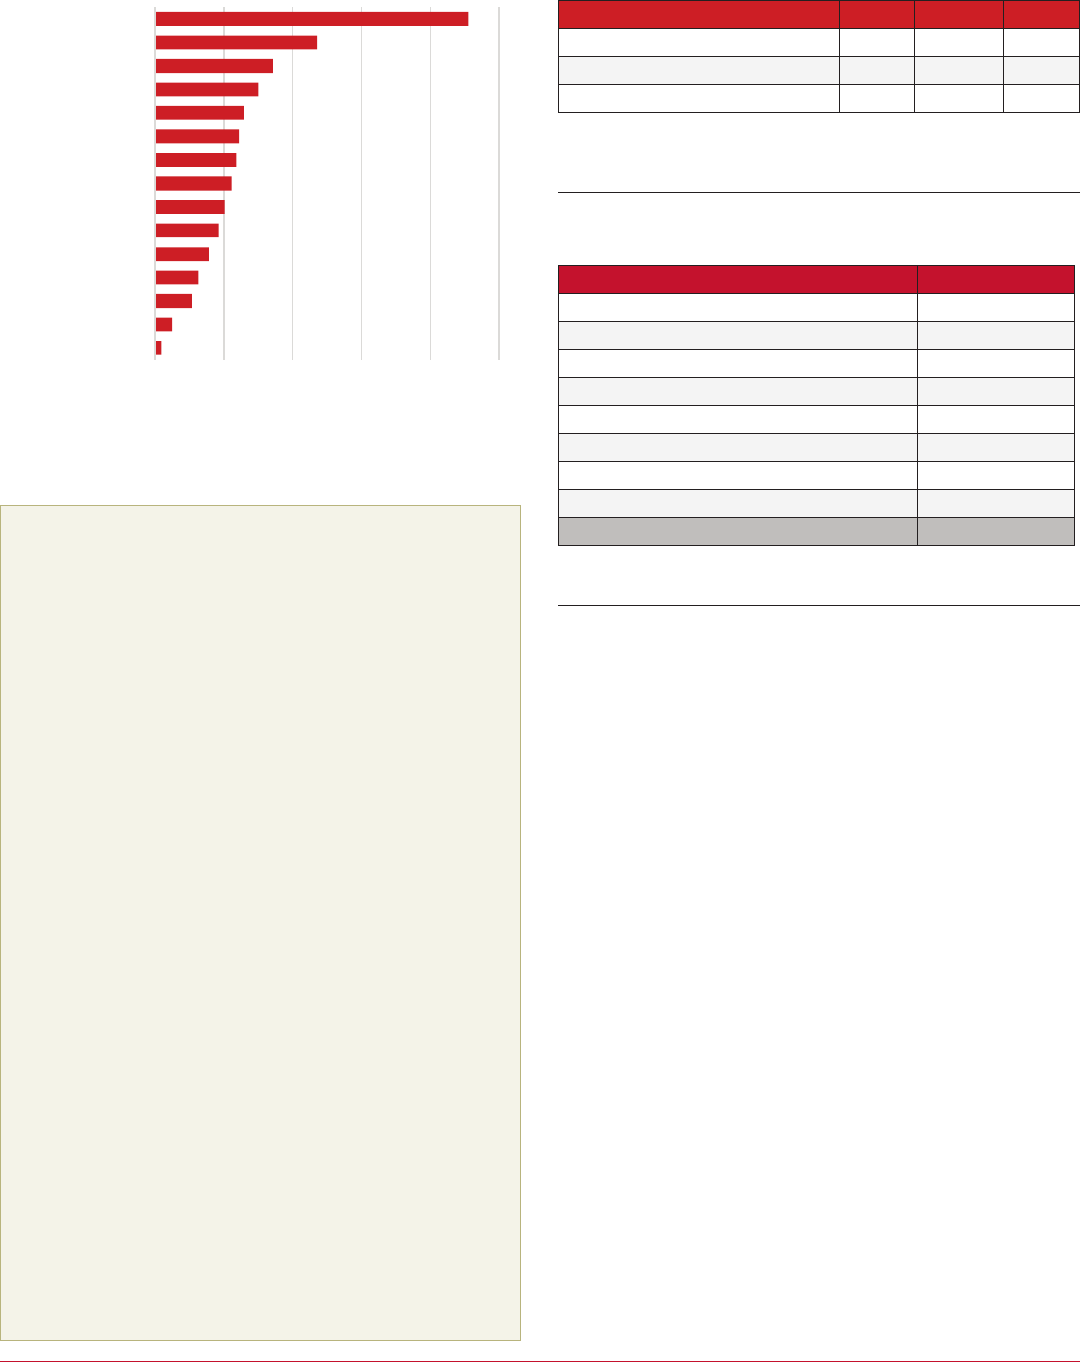
The 66 Utah suppliers to direct selling companies identied
for this study are manufacturers, service providers or ingredient
suppliers (see Figure 9).
13
Manufacturers for direct selling
companies provided 3,497 Utah jobs in 2020, nearly two-thirds
of the supplier total of 5,312 full-time and part-time jobs. In
the same year, service providers paid $86.2 million in wages,
nearly one-third of the supplier total. Companies that provided
ingredients to direct selling companies accounted for 12.8% to
13.6% of suppliers’ company count, employment and wages.
In 2020, the 66 selected suppliers in the direct selling industry
paid employees an aggregate $278.9 million annually. Among
these suppliers (not including direct selling companies in the
industry), the average wage per job was $52,497, which was
within 3% of the average of $53,896 for all other employment
in the state. Compensation at Utah direct selling suppliers also
included employer benets estimated at $13,801 per job, on
average. Wages and benets added to $66,298 per job and
$352.2 million in total compensation for supplier employees.
17 (19%)
10 (11%)
20 (22%)
12 (13%)
13 (14%)
10 (11%)
4 (4%)
3 (3%)
2 (2%)
0 5 10 15 20 25
Less than 5
5 to 9
10 to 19
20 to 49
50 to 99
100 to 249
250 to 499
500 to 1,499
1,500 and above
Companies
Jobs
14,925
15,497
15,828
16,707
16,784
17,487
18,697
19,543
19,891
20,077
20,925
0 5,000 10,000 15,000 20,000 25,000
Misc. Store Retail
Bldg. & Garden Retail
Metal Product Mfg.
Publishing
Federal Military
Direct Selling
Amusement & Rec.
Food Manufacturing
Accommodation
Arts & Sports
Agriculture
$53,891
$53,782
$63,652
$0 $20,000 $40,000 $60,000 $80,000
All Industries
Other Industries
Direct Selling Industry
177
490
1,063
1,258
1,563
1,842
2,023
2,219
2,359
2,434
2,571
2,994
3,418
4,715
9,112
0 2,000 4,000 6,000 8,000 10,000
Natural resources
Information services
Other services
Finance & insurance
Government
Real estate
Professional services
Leisure & hospitality
Wholesale trade
Health & education
Transport. & utilities
Business services
Construction
Manufacturing
Retail trade
2
2
20
51
69
88
104
843
1,200
1,400
1,946
5,953
0 1,500 3,000 4,500 6,000
Real estate
Other services
Finance & insurance
Professional services
Construction
Health & education
Information services
Business services
Transport. & utilities
Wholesale trade
Manufacturing
Retail trade
$540.7
(67.4%)
8,614
(73.8%)
$223.7
(27.9%)
2,357
(20.2%)
$38.2
(4.8%)
707
(6.1%)
0% 20% 40% 60% 80% 100%
Wages
($ Millions)
Employment
(Jobs)
Utah Salt Lake Other Counties
$155.1
(55.6%)
3,497
(65.8%)
36
(54.5%)
$86.2
(30.9%)
1,136
(21.4%)
21
(31.8%)
$37.6
(13.5%)
679
(12.8%)
9
(13.6%)
0% 10% 20% 30% 40% 50% 60% 70% 80% 90% 100%
Wages
($ Millions)
Employment
(Jobs)
Number of
Companies
Manufacturing Services Ingredients
66
(100.0%)
5,312
(100.0%)
$278.9
(100.0%)
4,336
(6.9%)
21,682
(6.9%)
40,695
(64.4%)
203,473
(64.4%)
18,192
(28.8%)
90,961
(28.8%)
0.0% 20.0% 40.0% 60.0% 80.0% 100.0%
Average
Annual
Five-Year
Total
Utah Other States (U.S.) International
316,116
(100.0%)
63,223
(100.0%)
Figure 9: Employment and Wages of Selected Direct Selling Suppliers by Type, 2020
Source: Utah Department of Workforce Services, FirmFind and information request

August 2022
I
gardner.utah.edu INFORMED DECISIONS
TM
8
Supplier activity in the direct selling industry is more evenly
distributed statewide than direct selling companies themselves.
While nearly nine out of 10 direct selling establishments were in
the industry’s two leading counties, Utah County and Salt Lake
County, only 69% of supplier establishments were located there
in 2020 (see Table 6). Three other counties, Weber, Davis and
Washington, were home to multiple suppliers to direct selling
companies. Additionally, at least one supplier operated in Cache,
Emery and Millard counties, which feature large rural areas.
Table 6: Selected Utah Suppliers to Direct Selling
Companies by County, 2020
County Establishments Share of Total
Utah 26 36.6%
Salt Lake 23 32.4%
Weber 9 12.7%
Davis 7 9.9%
Washington 3 4.2%
Cache 1 1.4%
Emery 1 1.4%
Millard 1 1.4%
State Total 71 100.0%
Note: These 71 Utah establishments represent 66 companies, three of which had two or
more business locations within the same county, and one had two or more business
locations in dierent counties.
Source: Dorsey & Whitney LLP and Utah Department of Workforce Services
gardner.utah.edu
I
August 2022
INFORMED DECISIONS
TM
9
Exceptional levels of in-state production for domestic and
international markets marked Utah’s role in the direct selling
industry. Utah, a state with under 0.1% of the world’s population,
provided more than 6% of the industry’s global sales in 2020.
While Utah produces just under 1% of U.S. GDP, it provided at
least 10% of direct selling products bought nationwide. At the
same time, in-state purchases in Utah exceeded the national
average of sales per capita.
A 2021 industry survey of several large companies
headquartered in Utah informs Sections 3 and 4. The survey
supplements a state government dataset on the full set of
companies addressed in Sections 1 and 2, as well as previously
published ndings from national surveys of direct selling
companies. The rm Dorsey & Whitney collected detailed
information on sales and sales representatives from 10 of the
91 direct selling Utah companies.
14
The surveyed companies
operated in one or more industry segments: health and
wellness (10 companies), beauty and fashion (four), and other
products (one).
15
These companies provided more than half
(57.5%) of industry employment statewide in 2020, and their
6,143 employee jobs paid $410.2 million in annual wages. Due
to their importance in the Utah, national and international
direct selling landscape, parts of Section 3 and 4 reference
survey results from companies’ sales and sales representatives.
State Comparisons: Utah Provides More Direct Selling
Products Than It Consumes
Utah is a signicant market for the retail activity of direct
selling companies headquartered either within or outside Utah.
State comparisons suggest Utah consumers have a moderately
high anity for direct selling products and networks. In 2020,
Utah ranked ninth in terms of direct sales per capita.
16
At $215
per adult living in the state, Utah spending exceeded the $155
U.S. average. The nationwide Direct Selling Association, which
represents the industry, surveyed a sample of direct selling
companies and estimated that there were $498.8 million in
Utah retail purchases in 2020.
17
Besides being a market for direct sellers, Utah is an established
industry hub, and a signicant portion of the $40.1 billion in
2020 direct selling nationwide originated in the state.
18
Utah’s
nationwide direct product sales far exceed those from within
the state. While Utah consumers accounted for 1.2% of U.S. retail
sales in the industry, Utah direct selling companies provided
over 10.0% of direct selling nationwide.
19
Section 3: Sales at Home and Abroad
Sales From Utah Direct Selling Companies Exceed $10
Billion, Mostly International Exports
Ten large Utah direct selling companies surveyed reported a
total of $10.3 billion in global sales during 2020, 3.0% of total
industry sales from Utah (see Table 7).
20
From a state with 0.04%
of the world’s population, these companies represented 6.1%
of the industry’s global sales of $168.3 billion.
21
Including all
companies in the industry, not just the 10 survey participants,
Utah direct selling companies generated substantially more
than 3.0% of statewide sales in all industries combined, and
more than 6.1% of global sales in the direct selling industry
itself.
22
Of total sales from the 10 companies surveyed, most
were international exports: 61.1% or $6.3 billion. In 2020,
these direct selling exports represented 35.6% of Utah’s total
international exports of $17.7 billion in commodities (see Figure
10).
23
Direct selling companies accounted for 71.7% of Utah’s
$8.8 billion in non-gold commodity exports. The remaining
38.9% of the selected companies’ global sales, $4.0 billion,
were domestic sales in Utah and other states. Total sales ranged
from $0.2 billion to $2.6 billion for individual companies, and
their international shares ranged from 13.3% to 90.6% of total
sales. The extent of out-of-state distribution from this Utah
Table 7: Sales by Destination for Selected Utah Direct
Selling Companies, 2020
(Billions of Dollars)
Destination Sales Share
Domestic (U.S.) $4.0 38.9%
International (Exports) $6.3 61.1%
Total $10.3 100.0%
Note: Data aggregated from the survey responses of 10 companies headquartered in Utah.
Source: Dorsey & Whitney LLP, 2021 direct selling industry survey
Figure 10: Exports from Utah Direct Selling
Companies, 2020
(Share of Statewide Exports for 10 Direct Selling Companies,
Which Reported a Combined $6.3 Billion in Exports)
Note: Commodities exclude services. Statewide gold exports were $8.9 billion.
Trade data not available for 81 of Utah’s 91 direct selling companies.
Source: Dorsey & Whitney LLP; U.S. Census Bureau, USA Trade Online
$53,782
$63,652
$0 $20,000 $40,000 $60,000 $80,000
Other Industries
Direct Selling Industry
71.7% 28.3%
35.6% 64.4%
0% 20% 40% 60% 80% 100%
Total Utah
Commodity Exports
Utah Non-Gold
Commodity Exports
Direct Selling Industry Other Industries
Direct impacts
(Direct selling)
Indirect and induced impacts
(Beyond the direct selling industry)
100.0%
($8.8 Billion)
100.0%
($17.7 Billion)
17,487
20,751
$1.329.9
$1,347.4
38,238 jobs
1.8% of Utah
employment
$2,677.3 million
2.2% of Utah
earnings
15 (16%)
4 (4%)
6 (7%)
9 (10%)
18 (20%)
51 (56%)
0 10 20 30 40 50 60
Other Products
Food & Beverages
Essential Oils
Services
Beauty & Fashion
Health & Wellness
15,497
15,828
16,707
16,784
17,487
18,697
19,543
19,891
0 5,000 10,000 15,000 20,000 25,000
Bldg. & Garden Retail
Metal Product Mfg.
Publishing
Federal Military
Direct Selling
Amusement & Rec.
Food Manufacturing
Accommodation
$0.0
$20.0
$40.0
$60.0
$80.0
$100.0
$120.0
$140.0
$160.0
$180.0
$200.0
State Local
$127.1
$64.3
Tax Revenues
Revenues
$191.4
$38.1
$8.5
Government
Operating Expenditures
$46.6
$89.0
$55.8
Net State and
Local Revenue
$144.7
225,155 (71.2%) 90,961(28.8%)
0 100,000 200,000 300,000
Domestic (U.S.) International
316,116
(100.0%)

August 2022
I
gardner.utah.edu INFORMED DECISIONS
TM
10
industry brings substantial income and employment into the
state. In contrast, in-state sales do not add signicant economic
impacts, although they are associated with economic activity
because resources are used and recirculated within the state.
The $4.0 billion in direct selling from these Utah companies
made up 10.0% of the estimated $40.1 billion in domestic sales
from all companies in the U.S. industry.
24
By the comparison, the
state’s share of nationwide GDP across all industries is just under
1%. This percentage understates Utah’s outsized participation in
the industry by all Utah direct selling companies. For example,
the 10 companies made up only 57.5% of total employment at
all 91 direct selling companies included in this report.
gardner.utah.edu
I
August 2022
INFORMED DECISIONS
TM
11
The direct selling industry’s network of independent
contractors connect with consumers and support product
distribution. These self-employed sales representatives
are more common in Utah than most other states. Typical
incomes, which vary widely by company and individual, are
below $10,000. People involved in direct selling in the U.S. are
disproportionately female, White, and Hispanic or Latino. Many
of these entrepreneurs fall within demographic cross-sections
with below-average incomes, rates of business ownership,
and labor-force participation. As of 2020, nearly 230,000 non-
employee sales representatives and discount buyers in Utah
were involved with direct selling companies. Worldwide, direct
selling companies headquartered in Utah had at least 4.9
million independent sales representatives.
Direct Selling Terms
People involved in direct selling include sales representatives
and discount buyers, each dened below. This nomenclature
for industry participants who are not employees follows
the conventions of the Direct Selling Association (DSA), a
nationwide industry advocate and trade association.
Sales representatives are people who create a business selling
consumer goods or services, either alone or with their
team. They are independent contractors, not employees of
direct selling companies. Sales representatives may also be
called direct sellers, aliates, participants, distributors, or
consultants.
Discount buyers or preferred customers are the terms
the industry uses to describe customers who purchase
products and services at a discount and do not participate
in the business opportunity. Discount buyers have
signed an agreement that makes them eligible to sell to
consumers and sponsor team members. In their responses
to DSA’s Growth and Outlook Survey, companies often do
not distinguish between active sales representatives and
discount buyers eligible to sell who have $0 in current-
year sales.
25
For example, just under one-third of sales
representatives who are independent contractors for a
large Utah company documented any sales in 2020.
Employees at direct selling companies are counted sepa-
rately from self-employed sales representatives or other
people involved in direct selling. Sections 1 and 2 provide
employment measures for the direct selling industry.
Section 4: Sales Representatives
People Involved in Direct Selling: Nearly 230,000
Sales Representatives and Discount Buyers in Utah
Direct selling companies provide opportunities for self-
employed independent contractors throughout the state.
In 2020, besides direct selling employees, an estimated
229,797 people in Utah participated in the industry as sales
representatives (independent contractors operating their own
businesses) or discount buyers (preferred customers who do
not make sales), together 9.9% of the adult population reported
by the U.S. Census Bureau (Direct Selling Association, 2021b).
Utah’s share was well above the national average of 6.5%, and
Utah ranks ninth among all states and DC in this regard.
26
Several large companies headquartered in Utah responded
to a 2021 industry survey conducted for this study. According
to responses, nine Utah direct selling companies created
entrepreneurship opportunities for 21,457 in-state sales
representatives in 2020 (see Table 8), 9.3% of the estimated
statewide total of 229,797 sales representatives and discount
buyers.
27
One company had at least one sales representative
in every county of the state, and more than 100 jobs for sales
representatives in six Utah counties.
28
The vast majority of independent sales representatives who
contract with Utah direct selling companies surveyed lived
and worked outside the state. In 2020, nearly 4.9 million sales
representatives were aliated with nine large Utah companies
that responded to an industry survey.
29
Three-fourths of these
independent direct sellers were outside the U.S., 3.7 million;
one-fourth were in the U.S., 1.2 million sales representatives.
Less than 1% of the global sales force lived and worked in Utah.
Table 8: Sales Representatives for Selected Utah Direct
Selling Companies, 2020
Location Independent Sales Representatives Share
Utah 21,457 0.4%
Other States 1,195,861 24.6%
International 3,634,667 74.9%
Total 4,851,985 100.0%
Note: Sales representatives are independent contractors who are self-employed. Data
represents nine companies with a combined $7.9 billion in global sales. One company
provided Utah and U.S. counts without information on any international sales
representatives the company may have had.
Source: Dorsey & Whitney LLP, 2021 direct selling industry survey
August 2022
I
gardner.utah.edu INFORMED DECISIONS
TM
12
Self-Employment Income as Independent Sales
Representatives Varies
Six Utah direct selling companies with a combined $4.9 billion
in global sales reported the income earned by their in-state sales
representatives.
30
In 2020, their 15,322 sales representatives
earned a collective $94.8 million in documented commissions
and related income. The mean of annual earnings from direct
selling (before expenses) was $6,186 per representative, and
company-specic means ranged from $574 to $10,650 per
representative.
31
Naturally, top performers inuenced these
means: company medians for their sales representatives’ annual
earnings ranged from $70 to $3,000 before expenses. Companies’
income disclosure statements provide further details.
32
A prior nationwide survey noted direct selling income
variability, with 7% of sales representatives reaching
cumulative prots above $10,000, and 47% losing money
by their participation over the years before 2017, after
subtracting expenses.
33
In a position as exible as that of an
independent contractor, the time and eort they devote to
selling varies widely by sales representative. Moreover, many
sales representatives purchase products primarily for personal
use rather than developing their networks and promoting the
goods and services of direct selling companies.
Direct Seller Demographics: Nationwide Participation
Among Women and Racial and Ethnic Groups
Direct selling companies oer exible entrepreneurial
opportunities that attract independent sales representatives
from broad Utah demographic groups, including those with low
incomes and below-average rates of business ownership and
labor-force participation.
34
Nationwide, people involved with
direct selling in 2020 were disproportionately female, White, or
Hispanic or Latino.
35
Women’s strong position in direct selling is
signicant because on average, median income for women in
the state was 57% lower than for men from 2015 to 2019. Apart
from direct selling companies’ employees, people involved in
direct selling include independent sales representatives and
discount buyers in the U.S.
36
Separate Utah demographic data
for the industry is lacking for the 229,797 people involved in
direct selling in the state.
In 2020, U.S. women were much more likely than men to
be involved with direct selling and accounted for 75% of the
group, well above women’s business ownership rates in other
industries (see Table 9).
37
Direct selling companies created
entrepreneurial opportunities for women in Utah, and their
labor-force participation rate of 62.1% was 17.2 percentage
points below men’s from 2015 to 2019.
38
This direct selling
gender dynamic favoring women was similar in 2015, but likely
less pronounced historically.
39
Furthermore, it is not uncommon
for women to ll prominent roles in Utah’s direct selling industry.
Of 19 direct selling companies with at least 100 Utah employees
in 2020, ve companies were women-led, and women were
among the founders of at least eight. The direct selling industry
includes pervasive and prominent examples of female business
owners and leaders, balancing gender equity in a state where
women solely owned 16.9% of Utah rms of any size in 2018
(while men owned 59.0%). Adding in co-ownership with men,
the female share rose to 41.0% (versus 83.1% for men), still far
below the 75% outcome for independent sales representatives
in direct selling.
40
Three ethnic or racial groups were overrepresented among
independent sales representatives for whom direct selling
became a potential source of additional income in 2020:
Hispanic or Latino, Native Hawaiian or Other Pacic Islander, and
White. Two of the three groups had statewide median incomes
well below those of Utahns who were White and not Hispanic
or Latino—24% lower for Hispanic or Latino people and 20%
lower for individuals who were Native Hawaiian or Other Pacic
Islander—based on averages from 2015 to 2019.
41
Nationwide,
Hispanic or Latino people made up 22% of individuals involved
Table 9: Demographics of People Involved in
Direct Selling, 2020
(Share of All Sales Representatives and Discount Buyers)
Group
Direct Selling
1
Adult Population
U.S. U.S. Utah
Sex
Women 75% 51% 50%
Men 25% 49% 50%
Race
3
Black or African American 8% 12% 1%
Asian 3% 6% 3%
Native Hawaiian or
Other Pacic Islander
5
1% 0% 1%
White 87% 64% 80%
Some Other Race
4
2% 9% 8%
Two or More Races
3
NA 9% 7%
Ethnicity
Hispanic or Latino 22% 17% 17%
Some Other Ethnicity 78% 83% 83%
Note:
1. Direct selling estimates for Utah are not available.
2. Race comparisons with the U.S. population are tentative. Direct selling companies
responded to the Growth & Outlook Survey that assigned multiracial individuals to a
single race group. In contrast, the Census Bureau uses a “Two or More Races” category
based on how people self-identify, and its other adult population shares constitute
single-race groups.
3. “Some Other Race” in the Growth & Outlook Survey combines responses of “American
Indian and Alaska Native,” “Not Identied,” and “Other (please describe).” The adult
population numbers shown here include American Indians and Alaska Natives.
4. U.S. adult population share for Native Hawaiian or Other Pacic Islander rounds down
from 0.2% to 0%.
Source: Direct Selling Association, 2021 Growth & Outlook Survey; U.S. Census Bureau,
2020 Decennial Census Redistricting Data and 2020 American Community Survey,
Integrated Public Use Microdata Series

gardner.utah.edu
I
August 2022
INFORMED DECISIONS
TM
13
with direct selling, compared with their 17% adult population
share. The Hispanic or Latino share rose from 20% to 22% in
2015.
42
The second overrepresented group, Native Hawaiian
or Other Pacic Islander, likewise made up a larger share in the
direct selling industry (1%) than in the U.S. adult population
(0%, rounded down from 0.2%). Finally, people who identied
as White constituted 87% of individuals involved in direct
selling nationwide, but only 64% of the U.S. adult population.
Other racial minorities were underrepresented among direct
selling entrepreneurs and discount buyers. For example, 8%
of the people involved in direct selling in 2020 were Black
or African American, well below their 12% share of the adult
population. This disparity was smaller in 2015 when 11% of
people involved in direct selling were Black or African American,
compared with their 12% share of the U.S. adult population.
43
In 2020, the largest dierence between direct selling and the
general population was among people belonging to racial
groups that were not itemized (i.e., “Some Other Race”) or “Two
or More Races.” Dierences in survey questions and methods
likely account for some disparities, particularly in these two
groups. Available data does not address Utah demographic
dynamics for direct selling participants.
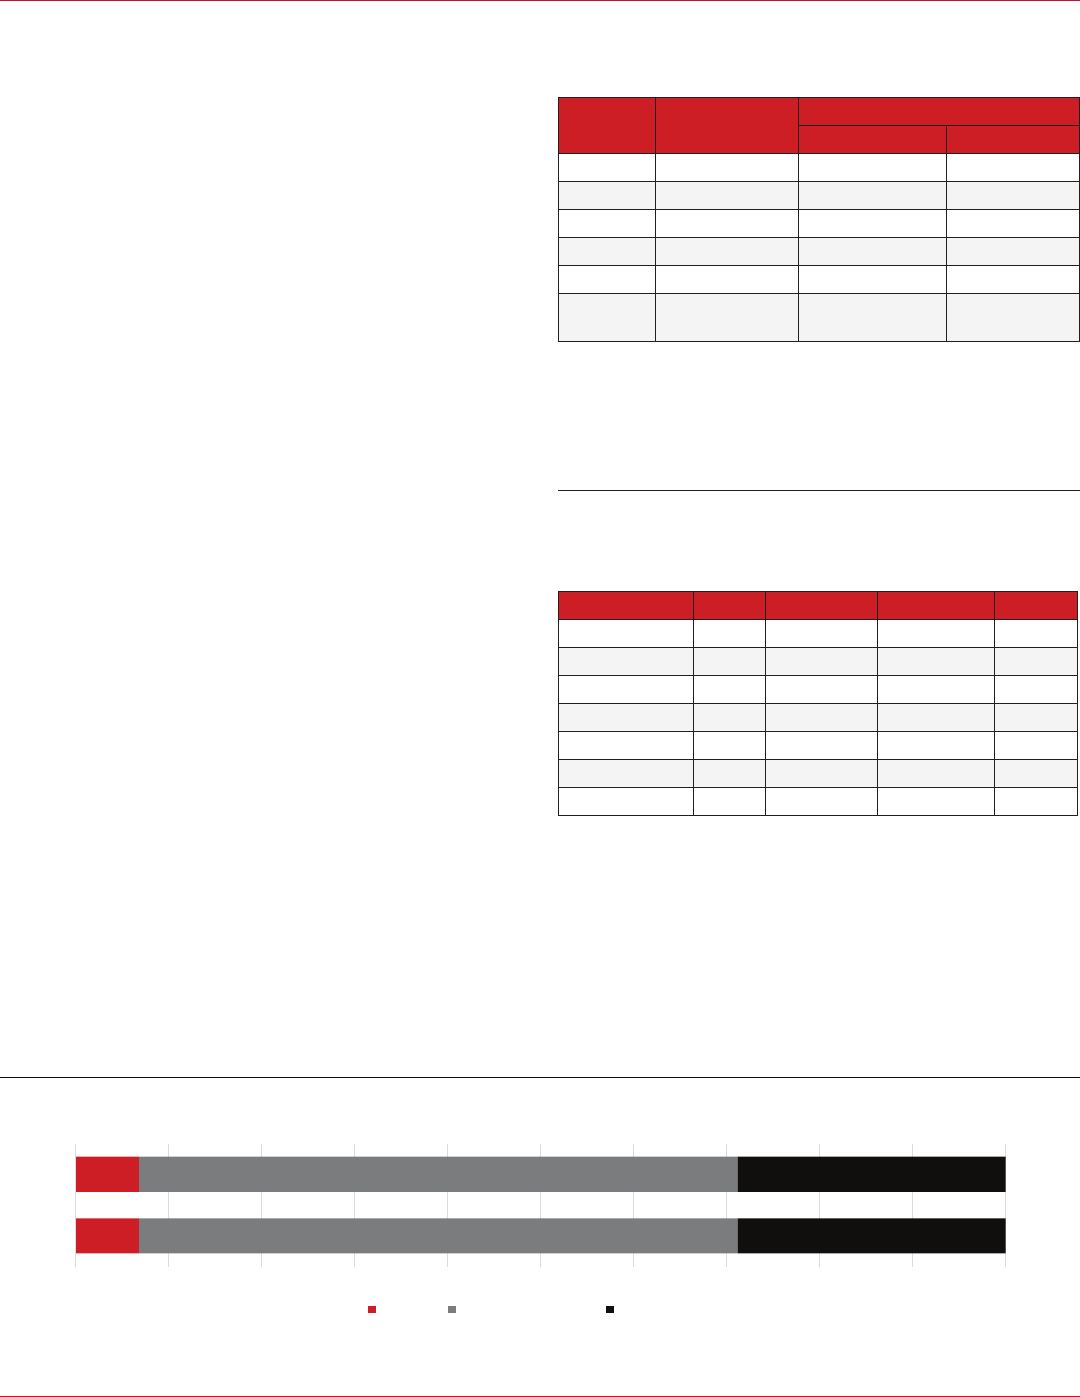
August 2022
I
gardner.utah.edu INFORMED DECISIONS
TM
14
Section 5: Conventions
Direct selling companies have held large events in Utah on
a regular basis. Each year, direct selling conventions bring an
estimated $41.6 million in consumer spending to Utah from
out-of-state visitors, based on visitation and spending patterns
from 2011 to 2019—before pandemic irregularities began. This
section analyzes conventions hosted by 10 large companies in
Utah’s direct selling industry, although events held by other
companies in the industry likely attracted additional visitors
and spending to the state.
Event Characteristics: 10 Multi-Day Conventions
Annually Averaging Nearly 6,200 Attendees
The companies that responded to a 2021 industry survey held
a combined total of 51 conventions in Utah from 2015 to 2019
(see Table 10). Each convention attracted an average of 6,198
attendees, and companies in this prominent industry subset
held a total of 7 to 14 events per year. Visitors typically stayed
an average of 3.8 days in Utah based on attendance gures and
the duration of events that were 1 to 10 days in length.
For direct selling conventions where company survey
responses named a venue or city, 99.7% of convention
attendance was at Salt Lake City events. The remaining 0.3%
of attendees went to events in Lehi, Midway, Park City and
Sandy. Companies specied a venue or city for 46 conventions,
accounting for more than half (60.1%) of total attendance at
direct selling conventions from 2015 to 2019.
Visitation From Over 310,000 Domestic and Interna-
tional Attendees Across Five Years
Most attendees to conventions held by Utah direct selling
companies were from outside the state. From 2015 to 2019,
at least 316,116 visitors attended these industry events (see
Table 11). Average annual attendance totaled 63,223 people,
including 58,887 out-of-state visitors. An estimated 93.1%
of attendees visited from another state or country, and the
remaining 6.9% were from Utah (see Figure 11).
Table 10: Selected Conventions Direct Selling Companies
Held in Utah, 2015–2019
Year
Number of
Conventions
Average per Convention
Attendance Duration (Days)
2015 7 6,792 3.7
2016 14 4,119 3.9
2017 12 6,393 4.4
2018 9 7,159 3.4
2019 9 7,751 3.4
All Years 51
(10.2 per year)
6,198 3.8
Note: Average duration calculated as an attendance-weighted mean. Event duration was
missing for six conventions: two in 2015 and one per year from 2016 to 2019. The Gardner
Institute imputed their duration from the weighted mean of the 45 conventions for which
duration was specied. Those 45 conventions accounted for more than half (59.5%) of
total attendance.
Source: Kem C. Gardner Policy Institute analysis of data from a 2021 direct selling industry
survey by Dorsey & Whitney LLP
Table 11: Annual Attendance at Selected Direct Selling
Conventions in Utah, 2015–2019
(Attendance by Location From Which Individuals Traveled)
Year Utah Other States International Total
2015 2,888 25,516 19,141 47,545
2016 4,247 40,431 12,984 57,662
2017 4,997 50,027 21,690 76,714
2018 5,012 45,194 14,229 64,435
2019 4,538 42,305 22,917 69,760
Total 21,682 203,473 90,961 316,116
Annual Average 4,336 40,695 18,192 63,223
Note: For ve conventions with limited data on visitor origin, the Gardner Institute
apportioned attendance by location based on attendance-weighted averages of the 46
conventions from companies that provided more attendance details. The heading “Other
States” refers to out-of-state domestic attendees from the U.S.
Source: Kem C. Gardner Policy Institute analysis of data from a 2021 direct selling industry
survey by Dorsey & Whitney LLP
Figure 11: Attendance at Selected Direct Selling Conventions in Utah, 2015–2019
(Number and Share of Visitors by Location From Which Individuals Traveled)
Source: Kem C. Gardner Policy Institute analysis of data from a 2021 direct selling industry survey by Dorsey & Whitney LLP
17 (19%)
10 (11%)
20 (22%)
12 (13%)
13 (14%)
10 (11%)
4 (4%)
3 (3%)
2 (2%)
0 5 10 15 20 25
Less than 5
5 to 9
10 to 19
20 to 49
50 to 99
100 to 249
250 to 499
500 to 1,499
1,500 and above
Companies
Jobs
14,925
15,497
15,828
16,707
16,784
17,487
18,697
19,543
19,891
20,077
20,925
0 5,000 10,000 15,000 20,000 25,000
Misc. Store Retail
Bldg. & Garden Retail
Metal Product Mfg.
Publishing
Federal Military
Direct Selling
Amusement & Rec.
Food Manufacturing
Accommodation
Arts & Sports
Agriculture
$53,891
$53,782
$63,652
$0 $20,000 $40,000 $60,000 $80,000
All Industries
Other Industries
Direct Selling Industry
177
490
1,063
1,258
1,563
1,842
2,023
2,219
2,359
2,434
2,571
2,994
3,418
4,715
9,112
0 2,000 4,000 6,000 8,000 10,000
Natural resources
Information services
Other services
Finance & insurance
Government
Real estate
Professional services
Leisure & hospitality
Wholesale trade
Health & education
Transport. & utilities
Business services
Construction
Manufacturing
Retail trade
2
2
20
51
69
88
104
843
1,200
1,400
1,946
5,953
0 1,500 3,000 4,500 6,000
Real estate
Other services
Finance & insurance
Professional services
Construction
Health & education
Information services
Business services
Transport. & utilities
Wholesale trade
Manufacturing
Retail trade
$540.7
(67.4%)
8,614
(73.8%)
$223.7
(27.9%)
2,357
(20.2%)
$38.2
(4.8%)
707
(6.1%)
0% 20% 40% 60% 80% 100%
Wages
($ Millions)
Employment
(Jobs)
Utah Salt Lake Other Counties
$155.1
(55.6%)
3,497
(65.8%)
36
(54.5%)
$86.2
(30.9%)
1,136
(21.4%)
21
(31.8%)
$37.6
(13.5%)
679
(12.8%)
9
(13.6%)
0% 10% 20% 30% 40% 50% 60% 70% 80% 90% 100%
Wages
($ Millions)
Employment
(Jobs)
Number of
Companies
Manufacturing Services Ingredients
66
(100.0%)
5,312
(100.0%)
$278.9
(100.0%)
4,336
(6.9%)
21,682
(6.9%)
40,695
(64.4%)
203,473
(64.4%)
18,192
(28.8%)
90,961
(28.8%)
0.0% 20.0% 40.0% 60.0% 80.0% 100.0%
Average
Annual
Five-Year
Total
Utah Other States (U.S.) International
316,116
(100.0%)
63,223
(100.0%)

gardner.utah.edu
I
August 2022
INFORMED DECISIONS
TM
15
Convention Visitor Spending for Economic Impact
Analysis: At Least $41.6 Million per Year From Outside
the State
Visitor spending from conventions held by Utah direct selling
companies attracted an estimated $41.6 million per year to
the state (see Table 12). This lower-bound estimate from direct
selling events held from 2015 to 2019 represents the activity of
10 signicant companies selected to participate in an industry
survey. The leisure and hospitality sector earned most of this
visitor spending as out-of-state attendees spent an average of
$423 per person on lodging, restaurants, entertainment, etc.
Retail purchases followed with an average of $219 per trip.
Local transportation earned the least at $64 per person, less
than 10% of the total.
The spending of guests traveling to Utah from another state
or country constitutes an economic impact. In contrast, the
spending of local attendees represents money that they likely
would have otherwise spent in Utah. The $41.6 million in out-
of-state visitor spending is part of the results for the industry’s
footprint in Section 1. Direct impacts from this spending include
497 jobs, of which more than two-thirds are in the leisure and
hospitality sector and one-fourth are in retail trade. Direct
personal income impacts include $14.6 million in employee
compensation.
Table 12: Non-Local Visitor Spending From Selected Direct
Selling Conventions in Utah, 2015–2019
(2020 Dollars)
Spending Category
Average
per Visitor
Annual
Total
Share
of Total
Leisure & Hospitality $423 $24,898,908 59.9%
Retail Trade $219 $12,894,077 31.0%
Transportation
*
$64 $3,779,299 9.1%
Total $706 $41,572,284 100.0%
*Transportation spending includes transit, rentals and parking, but not airfare, since an
unknown portion of that spending directly benets Utah’s economy for ights originating
from other states and countries.
Source: Kem C. Gardner Policy Institute and Dorsey & Whitney LLP

August 2022
I
gardner.utah.edu INFORMED DECISIONS
TM
16
Section 6: Research Methods
This report depends on multiple data sources and estimation
methods to illuminate a single-year snapshot of a signicant
Utah industry. The Gardner Institute relied on administrative
employment and wage data for named direct selling
companies in the industry in 2020. An industry survey in 2021
supplemented this data for a subset of companies by providing
details on sales, sales representatives and conventions. These
sources provided key inputs for economic and scal impact
modeling. However, data limitations precluded systematic
historical comparisons and trend analyses.
Industry Denition: Identifying Direct Selling
Companies and Their Suppliers
Utah’s direct selling industry consists of direct selling
companies and a variety of suppliers that provide them with
essential inputs and services. Research for this report relied on
industry feedback regarding which companies belonged in
these two categories in 2020. The direct selling company list
aims at comprehensiveness, while the supplier company list
is insightful without attempting to catalogue the myriad small
and large enterprises from which direct selling companies
purchase inputs.
With input from the Utah Direct Selling Coalition, the
professional rm Dorsey & Whitney LLP identied 91 direct
selling companies in Utah during 2020 (see Table 13). The criteria
for inclusion in this point-in-time industry denition were that a
company have employees working in Utah, not just customers,
and that a company primarily use direct selling methods
that rely on the entrepreneurship and personal networks of
independent sales representatives. Researchers veried the
companies’ presence and employment activity in Utah using
the Utah Department of Workforce Services’ (DWS) public
dataset FirmFind. Subsequently, DWS economists reviewed
and processed the nal list of companies after meeting with
Gardner Institute researchers about their information request.
Some product segments within Utah’s direct selling industry
overlap; one in 10 companies belong to more than one segment.
Classication by researchers involved judgment calls, such as
deciding whether a company’s products primarily t in the
Health & Wellness category versus Beauty & Fashion. Dorsey &
Whitney sta addressed determinations like these, and Gardner
Institute researchers reviewed product segment classications.
Dorsey & Whitney identied 66 in-state suppliers that provide
both goods and services inputs to direct selling companies (see
Table 14). The rm compiled and corroborated recommendations
from individuals in Utah’s direct selling industry for this list. The
guiding principle for inclusion was that a company’s primary
line of business be supplying inputs to direct selling companies.
Access to business customers in the industry must be seen as
a major or sole reason for their presence in the state. Without
Utah’s established direct selling industry, these suppliers would
likely not be viable in Utah, at least not at the level at which
they operated in 2020. To corroborate personal judgments by
professionals about whether a particular candidate met the
criteria for the list of Utah suppliers for this study, Dorsey &
Whitney selected only companies with two or more mentions
from either representatives of direct selling companies or an
industry expert.
Survey Methods: 2021 Data Collection From Leading
Utah Companies
Dorsey & Whitney LLP created an industry survey for
companies to report direct sales amounts, sales representatives
and in-state conventions. The Gardner Institute collaborated
with the rm to create the questionnaire. Dorsey & Whitney
invited 12 Utah direct selling companies to participate in
the industry survey (see Table 13). In May and June of 2021,
10 companies submitted responses. Dorsey & Whitney
compiled their responses and de-identied companies before
transmitting the data securely to the author. Gardner Institute
researchers then analyzed and interpreted the survey results.
Convention estimates in Section 5 involved additional
analysis. The Gardner Institute began with survey data it
previously collected regarding spending patterns from 2011 to
2019 for non-local attendees to six Salt Lake City conventions
of direct selling companies: doTERRA (two conventions),
Melaluca, USANA, Xango and Young Living. Attendance ranged
from about 5,000 to 30,000 people, and event duration was
four to seven days. Visitor spending averaged $830 per person
per trip in ination-adjusted 2020 dollars. To calculate single-
year aggregate spending, visitor spending by category was
multiplied by the average number of out-of-state visitors to
direct selling events from 2015 to 2019, based on an industry
survey conducted in 2021.
44
Calculations for the results in Table
12 required an adjustment for convention duration, which was
slightly longer for the events driving the estimates of spending
per visitor (4.4 days) than it was for the events driving the out-
of-state attendance estimate (3.8 days). Hence, the average
spending per visitor of $706 total for 2015–2019 diers from
the $830 total for 2011–2019 convention attendee surveys.
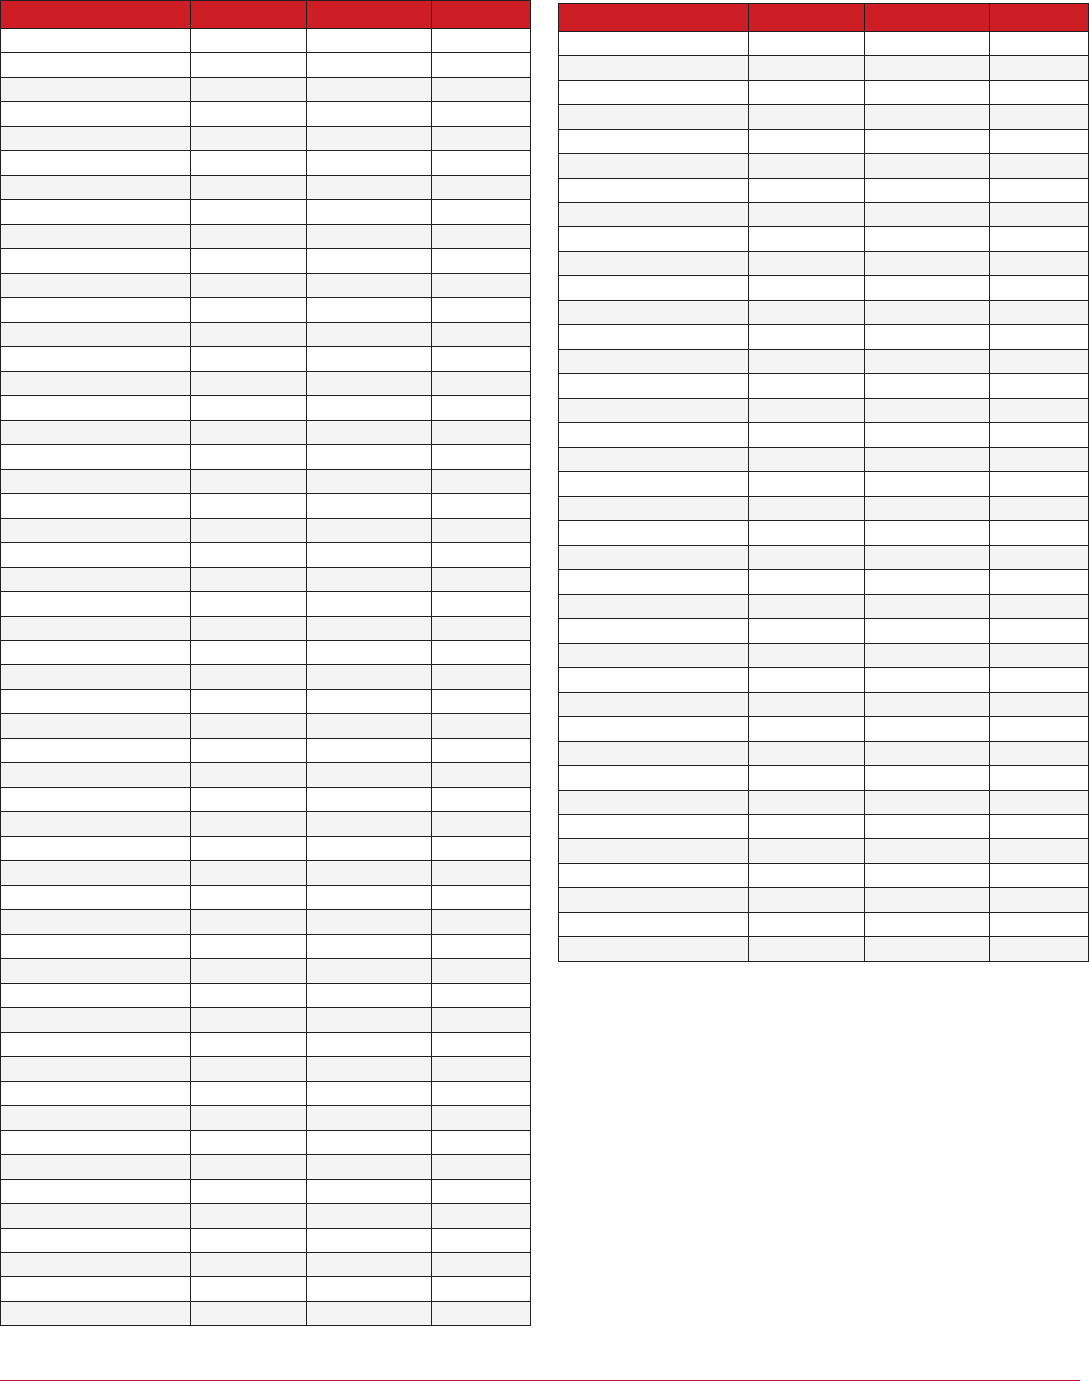
gardner.utah.edu
I
August 2022
INFORMED DECISIONS
TM
17
Table 13: Utah Direct Selling Companies
(Oce Location and Average Employment in 2020)
Company
1
County Employment
2
Surveyed
3
4Life Research USA Salt Lake 205 to 405 Yes
Activz Salt Lake 21 to 53 No
AddieJade’s Duchesne 10 to 19 No
Agnes & Dora Utah 10 to 19 No
Anovite Inc. Salt Lake 10 to 19 No
Apex Energy Solutions Washington 0 No
Aptive Environmental Utah 270 to 548 No
Arego Life Utah 5 to 9 No
ASEA Global Utah 100 to 249 Yes
Beauty Industry Group Salt Lake 50 to 99 No
BeneYOU Utah 20 to 49 No
Blue Raven Solar Utah 170 to 397 No
Caliber Smart Utah 20 to 49 No
Chalk Couture Salt Lake 50 to 99 No
Clad & Cloth Utah 10 to 19 No
Close to My Heart Utah 50 to 99 No
Coseva Utah Less than 5 No
doTERRA Utah 2,265 to 3,526 Yes
E. Excel International Salt Lake 20 to 49 No
Engage Global Utah 10 to 19 No
Enjoy Technology Salt Lake 5 to 9 No
Epicure Salt Lake 10 to 19 No
Forever Green Utah 10 to 19 No
GRENX Salt Lake 10 to 19 No
In a Pikle Salt Lake Less than 5 No
Invisus Utah 10 to 19 No
Jeunesse Salt Lake 50 to 99 No
Joy to Live Salt Lake Less than 5 No
Juuva Utah 5 to 9 No
Kuvera Global Davis 10 to 19 No
LGCY Power Utah 20 to 49 No
LifeVantage Salt Lake 100 to 249 Yes
LifeWave Salt Lake 10 to 19 No
Limbic Arc Utah Less than 5 No
Limitless Worldwide Salt Lake Less than 5 No
LIV International Utah 5 to 9 No
LivElite
4
Salt Lake Less than 5 No
LurraLife Davis 10 to 19 No
Max International Salt Lake 20 to 49 No
Modere Utah 100 to 249 Yes
Modexus Salt Lake Less than 5 No
MojiLife Utah 10 to 19 No
Nature’s Sunshine Utah 370 to 797 Yes
NewAge
5
Utah 161 to 371 Yes
New U Life Utah 50 to 99 No
NineFold Marketing Weber 20 to 49 No
Nu Skin Utah 606 to 1,260 Yes
Paparazzi Accessories Washington 250 to 499 No
Perfectly Posh Salt Lake 20 to 49 No
Pixingo Salt Lake Less than 5 No
Plunder Design Utah 100 to 249 No
Puratae Utah Less than 5 No
Q Sciences Utah 50 to 99 No
Company
1
County Employment
2
Surveyed
3
Rain International Utah 20 to 49 No
Renatus Davis 10 to 19 No
Rocky Mountain Oils Utah 10 to 19 No
Seint Washington 50 to 99 No
SendOutCards Salt Lake 50 to 99 No
Shaklee Salt Lake 5 to 9 No
Shine Cosmetics Utah 5 to 9 No
Sibu Beauty Salt Lake Less than 5 No
Sisel International Utah 20 to 49 No
Solle Naturals Utah 10 to 19 No
SPX Nutrition Salt Lake 1 to 4 No
Stampin’ Up
6
Utah 300 to 598 No
SupraNaturals Utah 100 to 249 No
Thrive Life Utah 100 to 249 No
Tranont Salt Lake 5 to 9 No
TruIQ Global Salt Lake 1 to 4 No
Truvy Salt Lake 50 to 99 No
Unicity International Utah 100 to 249 No
United Financial Freedom Salt Lake 10 to 19 No
Uppercase Living Salt Lake 5 to 9 No
USANA Health Sciences Salt Lake 520 to 1,048 Yes
Vantage Marketing Group Utah 10 to 19 No
Vasayo Utah 20 to 49 No
VIIVA Utah 5 to 9 No
Vísi Utah 10 to 19 No
Vitatrade Group Salt Lake 20 to 49 No
Wanae USA Salt Lake 1 to 4 No
Wink Naturals Utah Less than 5 No
Xyngular Utah 100 to 249 No
Yoli Salt Lake 50 to 99 No
Young Living Utah 1,505 to 3,007 Yes
Youngevity Utah 20 to 49 No
Younique Utah 300 to 598 Yes
Zallevo
7
Washington 10 to 19 No
Zija International Utah Less than 5 No
Zrii Salt Lake 5 to 9 No
Zyia Active Salt Lake 100 to 249 Yes
ZYTO Corp Utah Less than 5 No
Note:
1. Companies doing business under the name given here may also identify in 2020
employment and wage data by an alias, a former name, or that of a subsidiary or parent
company. Prominent examples include BioMedical Research Laboratories (4Life Research),
Immune Tree (Anovite), Synergy Worldwide (Nature's Sunshine), Morinda and ARIIX
(NewAge), Maskcara (Seint), First Green House Investment (TrulQ), Worth Unlimited (United
Financial Freedom), Hale & Wood (Uppercase Living), BRS Field Ops (Blue Raven), and Warr
Productions (Clad & Cloth).
2. Disclosure limitations prevent the reporting of exact employment counts by company.
Utah employment at direct selling companies does not include independent sales
representatives (direct sellers).
3. In 2021, Dorsey & Whitney conducted a company survey of 12 direct selling companies
addressing sales, sales representatives and conventions; 10 companies responded to at
least one question.
4. LivElite was formerly Syntec Global.
5. NewAge has three oces in Utah County and one in Davis County.
6. Stampin' Up also has a Kane County location, but most of its employment is in Utah County.
7. Zallevo operated as HealthSync Global until September 2020.
Source: Dorsey & Whitney LLP (company list) and Utah Department of Workforce Services
(location and employment)

August 2022
I
gardner.utah.edu INFORMED DECISIONS
TM
18
Modeling Economic Impacts
The economic impacts of the direct selling industry include
direct, indirect, induced and scal impacts. The rst three make
up total economic impacts. Direct impacts are from direct
selling companies themselves and from convention attendees’
spending at Utah businesses, while indirect and induced
impacts are from individuals and companies not primarily
engaged in direct selling. The Gardner Institute measures all
three types of impacts in terms of jobs and personal income.
The Gardner Institute typically estimates gross domestic
product (GDP) as part of its economic impact analysis for Utah
industries. GDP is a measure of the total economic activity of
a region and represents the value added from the creation
of goods and services. GDP is calculated by subtracting the
value of capital and labor inputs to production from outside
the industry or state from total output (sales). In the case
of direct selling, insucient data on output and inputs to
production made GDP calculations unreliable. The direct selling
Company
1
County Employment
2
Type
ABL Manufacturing Utah 20 to 49 Manufacturing
Albion Laboratories Davis 100 to 249 Manufacturing
All About Naturals Salt Lake Less than 5 Ingredients
Analytical Resource
Laboratories
Utah 20 to 49 Services
Balchem Corporation Salt Lake 10 to 19 Manufacturing
Barrington Nutritionals Davis 5 to 9 Ingredients
Biotron Laboratories Davis 20 to 49 Ingredients
Adaptive Health Salt Lake 100 to 249 Manufacturing
Blue Mountain Labs Utah 20 to 49 Manufacturing
Capstone Nutrition Weber 250 to 499 Ingredients
CAPTEK Softgel International Salt Lake Less than 5 Manufacturing
CorePack Manufacturing Utah 10 to 19 Manufacturing
CSB Nutrition Utah 100 to 249 Manufacturing
Deseret Laboratories Washington 100 to 249 Manufacturing
DirectScale Utah 20 to 49 Services
Dyad Laboratories Salt Lake 20 to 49 Manufacturing
Dynamic Blending
Specialists
Utah 50 to 99 Manufacturing
Elite Manufacturing &
Packaging
Utah 100 to 249 Manufacturing
Elite Ops Utah 20 to 49 Services
Equinox Nutraceutical Utah 50 to 99 Manufacturing
ESM Fulllment Salt Lake 10 to 19 Services
Flexpak Davis 50 to 99 Ingredients
Glanbia Nutritionals Salt Lake Less than 5 Manufacturing
Global Access Salt Lake 20 to 49 Services
Hudson Printing Salt Lake 100 to 249 Services
HWR Packaging Salt Lake 10 to 19 Manufacturing
InfoTrax Systems Utah 100 to 249 Services
Innophos Nutrition Davis 100 to 249 Services
Innovative Labs Utah 250 to 499 Manufacturing
InPivota Utah 20 to 49 Ingredients
Intermountain Nutrition Utah 250 to 499 Manufacturing
Level 3 Nutraceuticals Cache Less than 5 Manufacturing
LiquaDry Millard 50 to 99 Ingredients
Live Earth Emery 10 to 19 Ingredients
MBI Nutraceuticals Utah 10 to 19 Manufacturing
MeriCal Weber 100 to 249 Manufacturing
Modern Display Salt Lake 20 to 49 Services
Mineral Resources
International
Weber 20 to 49 Manufacturing
Nellson Nutraceutical Salt Lake 100 to 249 Manufacturing
Complete Merchant
Solutions
Utah 50 to 99 Services
Nutrabrand Labs Weber 100 to 249 Manufacturing
Nutraceutical Corporation Weber 105 to 258 Manufacturing
Nutrix International Salt Lake 100 to 249 Manufacturing
Origin Nutraceutical Utah 20 to 49 Manufacturing
Table 14: Selected Utah Suppliers to Direct Selling Companies
(Oce Location and Average Employment in 2020)
Company
1
County Employment
2
Type
Paragon Fulllment Salt Lake 5 to 9 Services
Pharmachem Weber 20 to 49 Ingredients
Pharmatech Labs Utah 120 to 298 Manufacturing
Prolix Nutrition Washington 20 to 49 Manufacturing
ProPay Utah 50 to 99 Services
Sabinsa Corporation Utah 20 to 49 Manufacturing
Scientic Consumables &
Instrumentation
Salt Lake 10 to 19 Services
Simplied Supplements Salt Lake 20 to 49 Manufacturing
The HB Group Salt Lake 10 to 19 Services
Tropical Resources Utah 20 to 49 Manufacturing
Univar Solutions USA Salt Lake 20 to 49 Services
UST Davis 120 to 298 Manufacturing
Sound Concepts Utah 50 to 99 Services
Veritiv Salt Lake 62 to 126 Services
Vitalpax Washington 50 to 99 Manufacturing
Vox Marketing Group Utah 20 to 49 Services
Vox Nutrition Salt Lake 100 to 249 Manufacturing
Wasatch Laboratories Weber 5 to 9 Manufacturing
West Wind Litho Salt Lake 20 to 49 Services
Western Botanicals Utah 20 to 49 Manufacturing
Western States Calibration Salt Lake 20 to 49 Services
Xirect Software Solutions Utah 5 to 9 Services
Note:
1. Companies doing business under the name given here may also identify by an alias or
parent company name. For example, Pharmachem is a division of Ashland Global
Holdings, and Verb Technology Company acquired Sound Concepts.
2. Disclosure limitations prevent the reporting of exact employment counts by company.
Source: Dorsey & Whitney LLP (company list) and Utah Department of Workforce Services
(location and employment)

gardner.utah.edu
I
August 2022
INFORMED DECISIONS
TM
19
companies and suppliers included in the study were unlike
other wholesale, retail and manufacturing companies. The
primary dierence was the unusually high volume of sales per
employee at direct selling companies, which was likely related
to the complementary work of an uncharacteristically large
external sales force of independent contractors. Typical GDP
estimation methods did not align with sales data reported by
the 10 large companies analyzed in this report, which made up
more than half of industry employment.
Direct impacts result when companies in the industry
spend money on payroll for employees and purchases from
suppliers. While out-of-state sales drive most company
spending, even the portion of companies’ activity sustained
by in-state revenue counts in this economic impact analysis,
which was guided by the research question “How much of
Utah’s economic activity would go away if the state did not
have a direct selling industry?”
45
Direct impacts also include
the payroll and purchases of companies where out-of-state
visitors to direct selling conventions spend. To establish
direct economic impacts, Gardner Institute researchers used
information that direct selling companies reported to the Utah
Department of Workforce Services in the Quarterly Census of
Employment and Wages. To estimate spending by convention
attendees, researchers used previous Gardner Institute visitor
surveys at direct selling events as well as results from a 2021
industry survey that Dorsey & Whitney conducted for this
report. Due to data limitations, the activity of independent
sales representatives is not specically modeled for the direct
selling industry’s economic impacts. However, sales operations
are included in economic impacts using estimates based on
averages from sectors with direct selling companies.
Quantifying indirect and induced impacts involves economic
modeling. Indirect impacts result from spending by in-state
companies from which direct selling companies purchase
inputs; Table 14 names and describes many of these suppliers.
Induced economic impacts result from in-state personal
spending by workers who earn income from direct selling
companies or their suppliers.
This study’s direct selling industry denition includes 66
suppliers to direct selling companies as part of the direct
impacts. This approach captures the indirect and induced
impacts for all activity at these key suppliers, including activity
in service of out-of-state direct selling companies. The Gardner
Institute designed a model to avoid double-counting with
supplier activity already estimated as part of indirect impacts.
The model uses industry averages to estimate the 66 suppliers’
portion of in-state purchases by direct selling companies.
Researchers counted employment, earnings, and GDP impacts
for these selected suppliers as direct impacts and removed
them from indirect impacts.
To estimate indirect and induced impacts that resulted from
the direct impacts of the direct selling industry, the Gardner
Institute customized an economic impact model. REMI PI+
version 2.5, which was developed by Regional Economic
Models, Inc., is a dynamic and multiregional simulation software
package that estimates the economic, population and labor-
market impacts of specic economic changes. The analytical
framework incorporates input-output relationships, general
equilibrium eects, inter-state migration, economic geography
and econometrics.
In the REMI model for Utah used in this study, aggregation
yields 23 economic sectors. Most activity in the direct selling
industry occurs in the retail trade or wholesale trade sectors,
but several companies belong to other sectors. Certain
estimates made by the model rely on sector averages regarding
business operations, such as the prole of intermediate goods
purchased. The Gardner Institute calibrated the model to reect
actual wages that direct selling companies reported paying in
Utah. However, the model does not precisely incorporate the
activity of independent sales representatives as an element
that is distinct from other individual and business contractors
common in the broader sector. Data limitations prevented
calibration in this respect.
Modeling Fiscal Impacts to Estimate Tax Revenues
and Government Expenditures
The Gardner Institute’s scal impact calculator uses economic
and demographic measures to estimate state and local revenues
and expenditures associated with Utah’s direct selling industry
(see Figure 12). Revenues are based on ratios of historical tax
payments to personal income, industry output and employment;
expenditures are based on historical averages of government
spending per capita. While the estimates include state and county
governments and school districts, they do not include revenue
to, or spending by, cities and towns due to data limitations.
Acknowledgements
The Gardner Institute research team relied on productive
collaborations with professional sta at four organizations
for this study. The author extends appreciation to the Utah
Department of Workforce Services and the rm Dorsey &
Whitney, LLP. The Utah Direct Selling Coalition and Utah
Governor’s Oce of Economic Opportunity commissioned
this study. The coalition is made up of 18 Utah-headquartered
companies (12 direct selling companies and six direct selling
suppliers).
The Gardner Institute warmly thanks the Utah Department
of Workforce Service’s David Fogerty, Bureau of Labor Statistics
manager, for conducting analyses with custom aggregations

August 2022
I
gardner.utah.edu INFORMED DECISIONS
TM
20
to support this study. Mark Knold, chief economist, and
Jeremias Solaris, workforce research and analysis director, were
instrumental in reviewing the data request and planning a
response.
In dialogue with Gardner Institute sta and representatives
of direct selling companies, the sta of Dorsey & Whitney in
Salt Lake City provided the list of companies that denes the
industry in this report. The rm also administered and assisted
in the design of an original survey of Utah direct selling
companies. Dorsey & Whitney sta facilitated industry feedback
Figure 12: Diagram of Fiscal Impact Calculations
State Fiscal Impacts Inputs* Local Fiscal Impacts
Personal Income Taxes Personal Income County Sales Taxes
State Sales Taxes Employment Property Taxes
Corporate Income Taxes Sales Revenue
State Non-Education Expenditures Total Population County Expenditures
State Public Education Expenditures School-Age Population Countywide Public Education Expenditures
State Higher Education Expenditures College-Age Population
*Calculation inputs are total direct selling economic impacts, including total direct, indirect and induced eects from the REMI PI+ economic model.
Source: Kem C. Gardner Policy Institute
for a robust external review of the research. Gardner Institute
researchers particularly recognize Troy Keller, partner, and Cloe
Nixon, government aairs analyst. The data they prepared and
their knowledge of the industry signicantly improved the
thoroughness and accuracy of the report.
The author also recognizes John Downen, senior advisor to
the Gardner Institute. His research design and REMI modeling
assistance was incredibly helpful, as well as his technical review
of an early draft of the report.
Endnotes
1. Economic impacts include selected suppliers within the direct selling
industry denition for Utah. Analysis methods avoid double-counting
supplier activity in direct impacts that is also part of the indirect impacts.
Section 6 provides more details on economic impact modeling for Section
1 results.
2. For all Utah and out-of-state direct selling companies, the Direct Selling
Association estimates nearly 230,000 independent sales representatives
and discount buyers lived in Utah. See Direct Selling Association. (2021a).
Direct Selling in the United States: 2020 Industry Overview. www.dsa.org/
statistics-insights/overview.
3. The 17,487 jobs in Utah’s direct selling industry include 11,678 jobs at
direct selling companies, 5,312 jobs at selected suppliers in the direct
selling industry, and 497 jobs from the direct economic impacts of visitor
spending from direct selling conventions in Utah. All three components
are also present in direct earnings impacts.
4. Retail impacts include direct selling as well as the purchase of direct sales
workers. Manufacturing and business services primarily include suppliers
to direct selling companies. Construction includes commercial projects for
offices and facilities for both the direct selling industry and other Utah
companies supported by spending from direct selling companies and
their employees. Construction also includes residential projects at the
homes of workers in direct selling and other industries that are part of
direct selling’s economic impacts.
5. Economic impact modeling addresses sales representatives for 91 direct
selling companies in Utah based on industry averages for supplier and
customer linkages. In addition, income data in Section 3 incorporates
Utah-specific metrics for sales representatives at 10 companies that
responded to a detailed survey.
6. Historically, some direct selling companies have incorporated multilevel
marketing, a type of direct marketing with incentives for sales
representatives to recruit and train other salespeople. The direct sales
industry today is defined by its person-to-person retail channels.
7. Fiscal impact results reflect the 157 direct selling companies and suppliers
included in this study’s industry definition.
8. Direct selling company employment includes employees and does not
include independent sales representatives in Utah who are self-employed.
9. Section 2 does not analyze direct selling industry employment that is part of
the direct economic impacts of convention visitor spending. Adding 497
jobs from conventions to the 11,678 jobs at direct selling companies and
5,312 jobs at selected suppliers in 2020 yields the total of 17,487 jobs in the
direct selling industry shown in Figure 1 (also see Table 1 in Section 1).
10. In the North American Industry Classification System (NAICS), the
“nonstore retailers” segment of the retail trade sector includes “direct
selling” (NAICS code 4543) based on a much broader definition than the
one used for this study. Under NAICS, direct selling includes many
business approaches that do not involve person-to-person sales or
multilevel marketing, such as the delivery of fuel, bottled water and
newspapers. Meanwhile, companies in NAICS categories for e-commerce
(retail or wholesale), manufacturing, and a variety of other services
incorporate the type of person-to-person direct selling that is a criterion
for this economic analysis. However, these companies are not found under
“direct selling” or “nonstore retailers” in the NAICS retail trade sector.
11. SupraNaturals is both a direct selling company and a supplier to other
companies in the industry. To avoid double-counting, the Gardner
Institute does not include the company among suppliers.
12. Economic impact modeling in Section 1 attempts to estimate the value of
all in-state direct selling supplier relationships. The 66 suppliers addressed
in Section 2 are part of the direct effects, and many other suppliers are
part of the indirect effects, that add to the industry’s total impact on Utah’s
economy.
13. Manufacturers also supply ingredients and other materials for direct
selling products, aside from transforming these inputs to add value. In

gardner.utah.edu
I
August 2022
INFORMED DECISIONS
TM
21
contrast, companies classified as ingredient suppliers primarily provide
inputs that are not yet finished products. Direct selling companies further
process these inputs.
14. Two of 12 surveyed companies did not respond, which brought the
response rate to 83.3% for most questions. Companies selected for the
survey were generally larger than other Utah companies in the direct
selling industry.
15. The total is 15 because one of the 12 companies that were sent the survey
questionnaire participated in three industry segments, and one company
participated in two segments.
16. Direct Selling Association. (2021b). Impact of Direct Selling by State, 2020.
Accessed May 18, 2022. https://www.dsa.org/statistics-insights/factsheets
17. Among all states, Utah ranked 27th in direct selling volume (aggregate
dollar amounts), slightly ahead of the Utah economy’s size, which was
29th in terms of GDP, according to the U.S. Bureau of Economic Analysis.
18. Direct Selling Association. (2021b). Impact of Direct Selling by State, 2020.
www.dsa.org/docs/default-source/industry-fact-
sheets/2020statestatsfactsheet.pdf
19. The 10.0% lower bound estimate of the share of U.S. direct selling
originating from Utah is based on 2020 sales reported by 10 large direct
selling companies operating in Utah. Since the 10 companies represent
only 57.5% of employment at direct selling companies, sales from all 91
Utah direct selling companies in this study would be higher than 10.0%.
20. In 2020, total sales (gross output) were $343.5 billion for all industries in
Utah. See Regional Economic Models, Inc. (2021). REMI PI+ economic
model v. 2.5, regional control. https://www.remi.com/wp-content/
uploads/2021/07/Model-Overview.pdf
21. The Business Research Company. (2021, May). Direct Selling Establishments
Global Market Report 2021. www.researchandmarkets.com/
reports/5323289/direct-selling-establishments-global-market; U.S. Census
Bureau. (2021, July). Quick Facts: Utah. www.census.gov/quickfacts/UT; U.S.
Census Bureau. (2021, December). International Database: World Quick
Facts (2020). www.census.gov/data-tools/demo/idb
22. The 3.0% and 6.5% shares represent 10 of 91 direct selling companies in
the industry.
23. International Trade Administration. (2022, March). State Economy and Trade
Factsheets. U.S. Department of Commerce. https://www.trade.gov/
data-visualization/state-economy-and-trade-factsheets
24. Direct Selling Association (2021b)
25. Direct Selling Association. (2020). DSA 2020 Growth and Outlook Report (p. 47).
26. In 2020, an estimated 16.7 million people in the U.S. were direct sales
representatives or discount buyers. The 6.5% share in 2020 was lower than
the 2015 share of 8.2% of the adult population involved in direct selling.
See Direct Selling Association. (2021a). Direct Selling in the United States:
2020 Industry Overview. www.dsa.org/statistics-insights/overview and
Direct Selling Association. (2016). Direct Selling in 2015: An Overview. www.
dsa.org/docs/default-source/research/growth-outlook/
dsa_2016gandofactsheet.pdf.
27. Many sales representatives in Utah work for the remaining in-state direct
selling companies or for out-of-state companies that participate in the
Utah market. In-state and out-of-state companies may have more discount
buyers in Utah than sales representatives.
28. Of 12 Utah companies surveyed, one response offered independent sales
representative counts aggregated by county.
29. Of 12 Utah companies surveyed, six responses were complete for
questions about independent sales representatives incomes.
30. Aggregated industry-wide information about independent sales
representatives’ income from direct selling is limited. Of 12 companies
surveyed, six provided income details for independent direct sellers in Utah.
Also, companies do not always know how much of the products sales
representatives and discount buyers order are resold, and pricing may vary.
31. Reporting varied in terms of whether companies included individuals
eligible to sell with no income in 2020 in companies’ average or median
calculations. Another method was to use the larger average for the subset of
eligible sales representatives who made sales that year. For example, in one
company, just under one-third of eligible sales representatives made sales
that were tracked. Removing sales representatives with zero sales from the
calculation increased the average by 216% for one company and 653% for
another company. The remaining three companies that responded provided
averages that included individuals with $0 in 2020 sales.
32. Examples of income disclosure statements are DoTERRA. (2019).
Opportunity and Earnings Disclosure Summary. https://media.doterra.com/
us/en/flyers/opportunity-and-earnings-disclosure-summary.pdf; Young
Living. (2020). Income Disclosure Statement. https://www.youngliving.com/
us/en/income-disclosure; Nu Skin. (n.d.). 2020 Brand Affiliate Sales
Compensation Summary: U.S. Market. https://www.nuskin.com/content/
dam/office/n_america/US/en/business_materials/distearnings.pdf; and
USANA Health Sciences. (n.d.) 2020 Income Disclosure Statement. https://
www.usana.com/static/images/na/Training/ComplianceCorner/
IncomeDisclosureStatement-US-EN.pdf.
33. The 2017 survey received responses from 601 current and former
participants in the U.S. direct selling industry regarding their cumulative
profit (income minus expenses) to date, without an explicit inflation
adjustment. See DeLiema, M., Shadel, D., Nofziger, A., & Pak, K. (2018).
AARP Study of Multilevel Marketing: Profiling Participants and their
Experiences in Direct Sales. AARP Foundation. www.aarp.org/content/dam/
aarp/aarp_foundation/2018/pdf/AARP%20Foundation%20MLM%20
Research%20Study%20Report%2010.8.18.pdf.
34. Backlund, M., Bateman, M., Brandley, A., Christensen, M., Dean, P., Downen,
J., Dejan, E., Gochnour, N., Hogue, M., Hollingshaus, M., Pace, L., Perlich, P.
S., Robinson, J., Springer, P., Summers, L., & Wood, J. (2021, May 6). Diversity
in Utah: Race, Ethnicity, and Sex (Data Book). Kem C. Gardner Policy Institute
(pp. 11 & 14). https://gardner.utah.edu/diversity-in-utah-data-book/
35. Direct Selling Association (2021a)
36. In 2020, direct selling companies estimated that 16.7 million people
participated in direct selling nationwide. Of that number, 7.7 million
(46.1%) were direct sellers and 9.0 million (53.9%) were discount buyers.
These figures may count people affiliated with multiple companies more
than once.
37. Limited Utah data suggests women’s representation in direct selling in the
state may exceed the national average. A 2021 industry survey of selected
Utah direct selling companies gathered responses from five companies
with a collective $4.3 billion in 2020 sales; of their 14,178 sales
representatives, 88.9% were women. Besides the small Utah sample size,
this high percentage is not directly comparable to the 75% average
nationwide because the latter share includes discount buyers who did not
direct sell in 2020.
38. Backlund et al. (2021, May 6). See endnote 34 for full citation.
39. Women’s share was similar in 2015, making up 77% of people involved in
direct selling (independent sales representatives and discount buyers) .
Two years later, a 2017 survey of current and former direct sales
representatives found that 60% were women, which suggested that
inclusion of women among direct selling entrepreneurs has trended
upwards. However, this finding for the “multilevel marketing” industry is
not directly comparable to single-year 2015 or 2020 survey results from
the Direct Selling Association. See DeLiema, M., Shadel, D., Nofziger, A., &
Pak, K. (2018) and Direct Selling Association (2016)
40. Backlund et al. (2021, May 6)
41. Backlund et al. (2021, May 6)
42. Direct Selling Association (2016)
43. Another source found an even smaller racial disparity among current and
former direct sales representatives in the U.S. who were surveyed in 2017;
in that year, 13% were Black or African American, slightly above their 12%
share of the general adult population. This finding is not directly
comparable to single-year 2015 or 2020 survey results from the Direct
Selling Association because the 2017 survey describes people involved in
the “multilevel marketing” industry at any point in their lives. See DeLiema,
M., Shadel, D., Nofziger, A., & Pak, K. (2018).
44. This study’s analysis of direct selling industry conventions estimates
economic impacts of visitors from outside Utah. However, estimates of
spending per visitor are for visitors from outside Salt Lake County.
Presumably, visitors from outside Utah spend at least as much as visitors
from outside Salt Lake County, some of whom commuted to a venue close
to home.
45. In the absence of Utah direct selling companies, in-state consumption of
their products would be diverted to alternative sources of these products
or substitutes, many of them from outside the state.

(EC) Direct Sales Aug2022
Kem C. Gardner Policy Institute Sta and Advisors
Leadership Team
Natalie Gochnour, Associate Dean and Director
Jennifer Robinson, Associate Director
Mallory Bateman, Director of Demographic Research
Phil Dean, Chief Economist and Public Finance
Senior Research Fellow
Shelley Kruger, Accounting and Finance Manager
Colleen Larson, Administrative Manager
Dianne Meppen, Director of Survey Research
Nicholas Thiriot, Communications Director
James A. Wood, Ivory-Boyer Senior Fellow
Sta
Eric Albers, Research Associate
Max Becker, Research Associate
Samantha Ball, Senior Research Associate
Andrea Thomas Brandley, Research Associate
Kara Ann Byrne, Senior Research Associate
Mike Christensen, Scholar-in-Residence
Nate Christensen, Research Associate
Dejan Eskic, Senior Research Fellow
Enas Farag, Research Assistant
Emily Harris, Senior Demographer
Michael T. Hogue, Senior Research Statistician
Mike Hollingshaus, Senior Demographer
Thomas Holst, Senior Energy Analyst
Jennifer Leaver, Senior Tourism Analyst
Nate Lloyd, Deputy Director of Economics
and Public Policy
Levi Pace, Senior Research Economist
Heidi Prior, Research Associate
Natalie Roney, Economist
Shannon Simonsen, Research Coordinator
Paul Springer, Senior Graphic Designer
Laura Summers, Senior Health Care Analyst
Faculty Advisors
Matt Burbank, College of Social and
Behavioral Science
Elena Patel, David Eccles School of Business
Nathan Seegert, David Eccles School of Business
Senior Advisors
Jonathan Ball, Oce of the Legislative Fiscal Analyst
Silvia Castro, Suazo Business Center
Gary Cornia, Marriott School of Business
Wes Curtis, Community-at-Large
John C. Downen, Camoin Associates
Theresa Foxley, EDCUtah
Dan Griths, Tanner LLC
Emma Houston, University of Utah
Beth Jarosz, Population Reference Bureau
Darin Mellott, CBRE
Pamela S. Perlich, University of Utah
Chris Redgrave, Community-at-Large
Wesley Smith, Western Governors University
Juliette Tennert, Utah System of Higher Education
Kem C. Gardner Policy Institute Advisory Board
Conveners
Michael O. Leavitt
Mitt Romney
Board
Scott Anderson, Co-Chair
Gail Miller, Co-Chair
Doug Anderson
Deborah Bayle
Cynthia A. Berg
Roger Boyer
Wilford Clyde
Sophia M. DiCaro
Cameron Diehl
Lisa Eccles
Spencer P. Eccles
Christian Gardner
Kem C. Gardner
Kimberly Gardner
Natalie Gochnour
Brandy Grace
Rachel Hayes
Clark Ivory
Mike S. Leavitt
Derek Miller
Ann Millner
Sterling Nielsen
Jason Perry
Ray Pickup
Gary B. Porter
Taylor Randall
Jill Remington Love
Brad Rencher
Josh Romney
Charles W. Sorenson
James Lee Sorenson
Vicki Varela
Ex Ocio (invited)
Governor Spencer Cox
Speaker Brad Wilson
Senate President
Stuart Adams
Representative Brian King
Senator Karen Mayne
Mayor Jenny Wilson
Mayor Erin Mendenhall
Partners in the
Community
The following individuals
and entities help support
the research mission of the
Kem C. Gardner Policy Institute.
Legacy Partners
The Gardner Company
Christian and Marie
Gardner Family
Intermountain Healthcare
Clark and Christine Ivory
Foundation
KSL and Deseret News
Larry H. & Gail Miller Family
Foundation
Mountain America Credit Union
Salt Lake City Corporation
Salt Lake County
University of Utah Health
Utah Governor’s Oce of
Economic Opportunity
WCF Insurance
Zions Bank
Executive Partners
Mark and Karen Bouchard
The Boyer Company
Clyde Companies
Salt Lake Chamber
Sustaining Partners
Dominion Energy
Staker Parson Materials and
Construction
Kem C. Gardner Policy Institute
I
411 East South Temple Street, Salt Lake City, Utah 84111
I
801-585-5618
I
gardner.utah.edu
